Understanding Resource Scenario Optimization Results
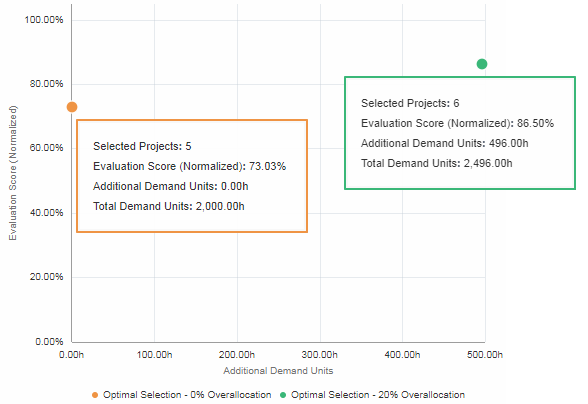
The Resource Scenario Optimization tool displays a chart that plots possible project selection scenarios as points. Each point represents an optimal project selection solution that maximizes a primary objective field and meets role availability constraints. The calculations performed during the process consider the availability and demand or allocation of the roles in your portfolio. This example uses demand units. Depending on your specified options, up to two points may be plotted:
- Optimal Selection - 0% Overallocation: This point represents a project selection scenario that maximizes the specified primary objective without overallocating any of the roles assigned to the selected projects. Hover over the point to view the number of selected projects in the solution, the maximized objective value, and the total number of demand or allocation units of the selected projects.
- Optimal Selection - n% Overallocation: This point represents an optimal project selection scenario given an acceptable amount of role allocation. The % Overallocation Allowed field in the Options section specifies the allowable percentage increase of the weekly Availability value of each role. Use this point to determine the amount of additional role demand or allocation units necessary to achieve a greater portfolio value.
Last Published Monday, June 22, 2026