Show Commands for Request Methods
The show survivability<method_name> command for SIP Request methods allow you to display specific statistical information about Request events that pass between the User Agent Server (UAS) and User Agent Client (UAC). Specific Request methods include:
| SIP Request Method | Description |
|---|---|
| INVITE | Method used to request a session. |
| REGISTER | Method used to register the client with the server according to the address in the To header field. |
| BYE | Method used to terminate an established media session. |
| ACK | Method is used to acknowledge final responses to INVITE requests. |
| CANCEL | Method is used to terminate pending requests. |
| OPTIONS | Method used to query a user agent or server about its capabilities and discover its current availability. |
| REFER | Method used by a user agent to request another user agent to access a URI or URL resource. |
| SUBSCRIBE | Method used by a user agent to subscribe the device for the purpose of receiving notifications (via the NOTIFY method) about a particular event. |
| NOTIFY | Method used by a user agent to convey information about the occurrence of a particular event. A NOTIFY is always sent within a dialog, when a subscription exists between the subscriber and the notifier. |
| UPDATE | Method used to modify the state of a session without changing the state of the dialog, |
| PRACK | Method used to acknowledge receipt of reliably transported provisional responses. This is generated by a UAC. |
| MESSAGE | Method used to transport instant messages (IM) using SIP. |
| INFO | Method used to send information in the middle of a session that doesn't modify the session's state. |
| PUBLISH | Method used to publish an event state to the server. |
| OTHER | Method used |
The following is an example of the show command output for an ACK Request.
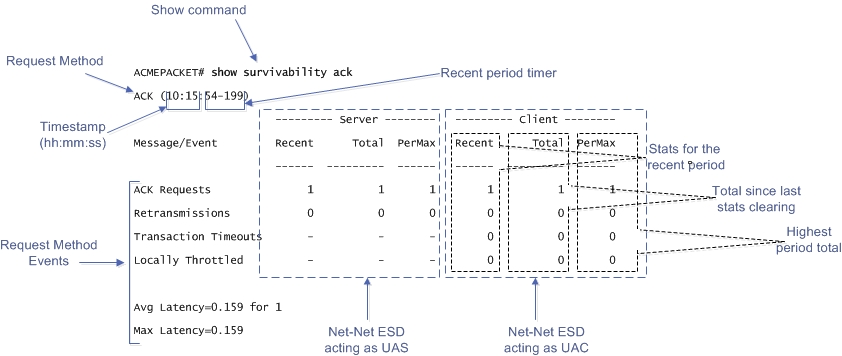
The example above provides a description for each area of the output. The Request method displays on the line directly under the command prompt (ACK in the above example), followed by the time stamp (hour:minute:second format), and then the recent period timer. The User Agent Server (UAS) data (when the Oracle® Enterprise Session Border Controller is acting as a server) is listed in the middle of the display, and the User Agent Client (UAC) data (when the Oracle® Enterprise Session Border Controller is acting as a client) is listed on the right side.
For both the UAS and UAC, the Recent column represents statistics for the recent period (the current period plus the last period). The Total column represents the total for a particular metric since the last stats clearing. Statistics are cleared either through the re-issue of the show survivability <method_name> command or on a reboot. The PerMax column represents the maximum for a given metric seen in any given individual (current) period.
Note:
The “Recent” column represents the recent period, which includes statistics from the current and the last period, which is why that number may be higher than what displays in the PerMax column.Recent Period Timer Operation
The Current period timer counts from 100 to 200 in one second increments as shown in the following illustration.
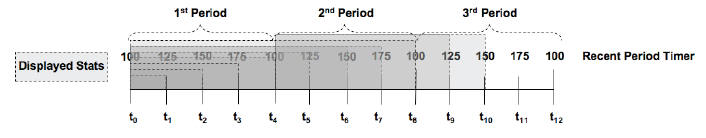
The statistics that display in the Recent column for any show survivability command reflects the appropriate behaviors for the associated value within the current period PLUS the last period (which constitutes a 100-200 second Recent period). This prevents the statistics from zeroing out between period transitions. So at time t4, in the display above, the statistics that display represent the last 100 seconds worth of behaviors (from the first period). The Recent Period statistics at time t6 represent the last 150 seconds of statistics (including 100 period 1). The Recent Period statistics at time t8 represent the last 100 seconds of statistics (including 100 from period 2).
The Recent period is the sum of the Active (current) period and the previous period.
SIP Request Method Examples
The following are examples of the show survivability <method_name> command. This command displays the recent and total Request events passed between the server and client when Survivability mode was enabled on the Oracle® Enterprise Session Border Controller. This output also displays the maximum number of Request events that occurred during a current time period window of 100 seconds, when Survivability mode was enabled.
You can specify any SIP Request method for the <method_name>. The following example uses the INVITE SIP Request name.
Example 1
ORACLE# show survivability invite
INVITE (10:15:44-189)
                      --------- Server --------   --------- Client --------
Message/Event         Recent      Total  PerMax   Recent      Total  PerMax
                      ------  ---------  ------   ------  ---------  ------
INVITE Requests            1          1       1       1          1       1
Retransmissions            0          0       0       0          0       0
100 Trying                 1          1       1       0          0       0
180 Ringing                1          1       1       1          1       1
200 OK                     1          1       1       1          1       1
Response Retrans           0          0       0       0          0       0
Transaction Timeouts       -          -       -       0          0       0
Locally Throttled          -          -       -       0          0       0
Avg Latency=0.130 for 1
Max Latency=0.130
Example 2
The following example uses the REGISTER SIP Request name.
ORACLE# show survivability register
REGISTER (09:55:26-150)
                      --------- Server --------   --------- Client --------
Message/Event         Recent      Total  PerMax   Recent      Total  PerMax
                      ------  ---------  ------   ------  ---------  ------
REGISTER Requests          4          4       4        4          4       4
Retransmissions            0          0       0        0          0       0
200 OK                     2          2       2        2          2       2
401 Unauthorized           2          2       2        2          2       2
Transaction Timeouts       -          -       -        0          0       0
Locally Throttled          -          -       -        0          0       0
Avg Latency=0.139 for 4
Max Latency=0.158
If Survivability mode was never initiated, the outputs show values of zero (0) in all columns.
show survivability commands
The following table describes the output for the “show survivability <method_name> command.
| Message/Event | Description |
|---|---|
| INVITE Requests | Number of INVITE Request events that occurred between the server and client during Survivability mode. |
| Retransmissions | Number of retransmission of INVITE Request events that occurred during Survivability. |
| <Response Code> | Type and number of responses that occurred between the Client and Server during Surviability. |
| Transaction Timeouts | Number of INVITE Request event timeouts that occurred during Survivability. |
| Locally Throttled | Number of INVITE Request events that were locally throttled during Survivability. This is the number of INVITE Request events that were transmitted during the regulation (slowing down) of network traffic by the Oracle® Enterprise Session Border Controller to minimize bandwidth congestion. |
| Avg Latency | Average amount of time for INVITE Request events to travel in the time period window with the amount of events specified. |
| Max Latency | Maximum amount of time it took for INVITE Request events to travel in the time period window. |