| Agile Product Lifecycle Management Monitoring Agile PLM using the Enterprise Manager User Guide Release 9.3.6 E71167-01 |
|

 Previous |
 Next |
| Agile Product Lifecycle Management Monitoring Agile PLM using the Enterprise Manager User Guide Release 9.3.6 E71167-01 |
|
Previous |
Next |
Oracle Enterprise Manager Grid Control 12c Release 4 enables the monitoring of Agile PLM applications along with other Oracle and non-Oracle technologies through a single Oracle Enterprise Manager Grid Control console.
It provides:
Centralized, multi-tier, multi-instance Agile PLM monitoring.
Discovery of Agile PLM servers and instances for each monitored SID.
Comprehensive, efficient, and secure health status data collection.
End-user experience monitoring for Agile PLM application modules.
Agile PLM business service dashboards and performance trend reports.
|
Note: Use of other Oracle Enterprise Manager capabilities may require additional licenses. |
After deploying Agile, perform the following steps to monitor an Agile target by using the Enterprise Manager Grid Control:
Install Enterprise Manager Grid Control with licenses.
You must install EMGC 12.1.0.5.
Name the queues OEM_AGENTS and OEM_METRICS.
You can create a target instance on one or more agents and for each unique Agile PLM Server. You can configure Agile Server as one of the targets for the agent and the agent begins the process of monitoring the target.
|
Note: Enterprise Manager does not monitor the target, once an entry is deleted from the Enterprise Manager Repository. |
|
Note: In OEM 12c, the system throws an error while monitoring Agile. |
Click Add Target. Add Target Manually on the Set-up page.
Select Oracle Fusion Middleware/Weblogic Domain and the Middleware page appears.
Click 'Add Using Guided Process'.
Administration Server Host: Select a host where Agile is installed by using the search button.
Agent: The Agent is selected once the user selects the Administration Server host.
Port: Weblogic Communication Protocol.
Username: superadmin
Password: Password for superadmin
Unique Domain Identifier: Define the name as a meaningful identifier (For example: - Agile93PLM_hostname_instance).
Click Targets > All Targets. The All Targets page appears.
Click the Target Name which you created for Agile.
The following status is displayed.
For details on how to enable JMX, please follow http://tomcat.apache.org/tomcat-8.5-doc/monitoring.html
|
Note: After removing JMX_SET, the system does not monitor Tomcat. |
Click Add Targets Declaratively by Specifying Target Monitoring Properties.
Select Apache Tomcat of Target Type.
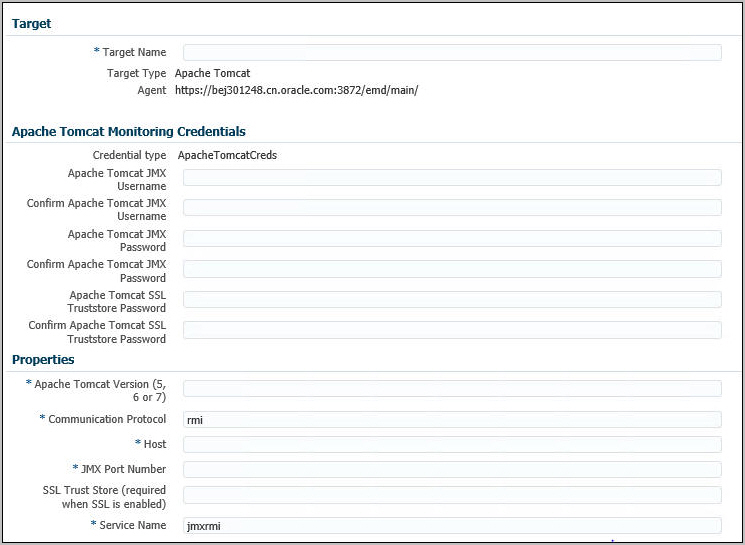
Click Add Manually... and the Target page appears.
Select the Monitoring Agent.
Target Name: Define the name as a meaningful identifier. (For example, FileManage_hostname_instance).
Apache Tomcat Monitoring Credentials: Enter the Credential details configured on Tomcat.
Properties:
Apache Tomcat Version(5, 6 or 7): 8.5
Communication Protocol: rmi
Host: Enter a host where the File Manager is installed.
JMX Port Number: Enter the JMX port Number configured in Tomcat.
SSL Trust Store (requird when SSL is enabled): Enter the SSL Trust Store if SSL is enabled.
Services Name: jmxrmi