Tutorial: Creating a New Dashboard
This tutorial explains how to create a dashboard based on the Oracle Communications Data Model webcat included with the sample Oracle Business Intelligence Suite Extended Edition reports delivered with Oracle Communications Data Model.
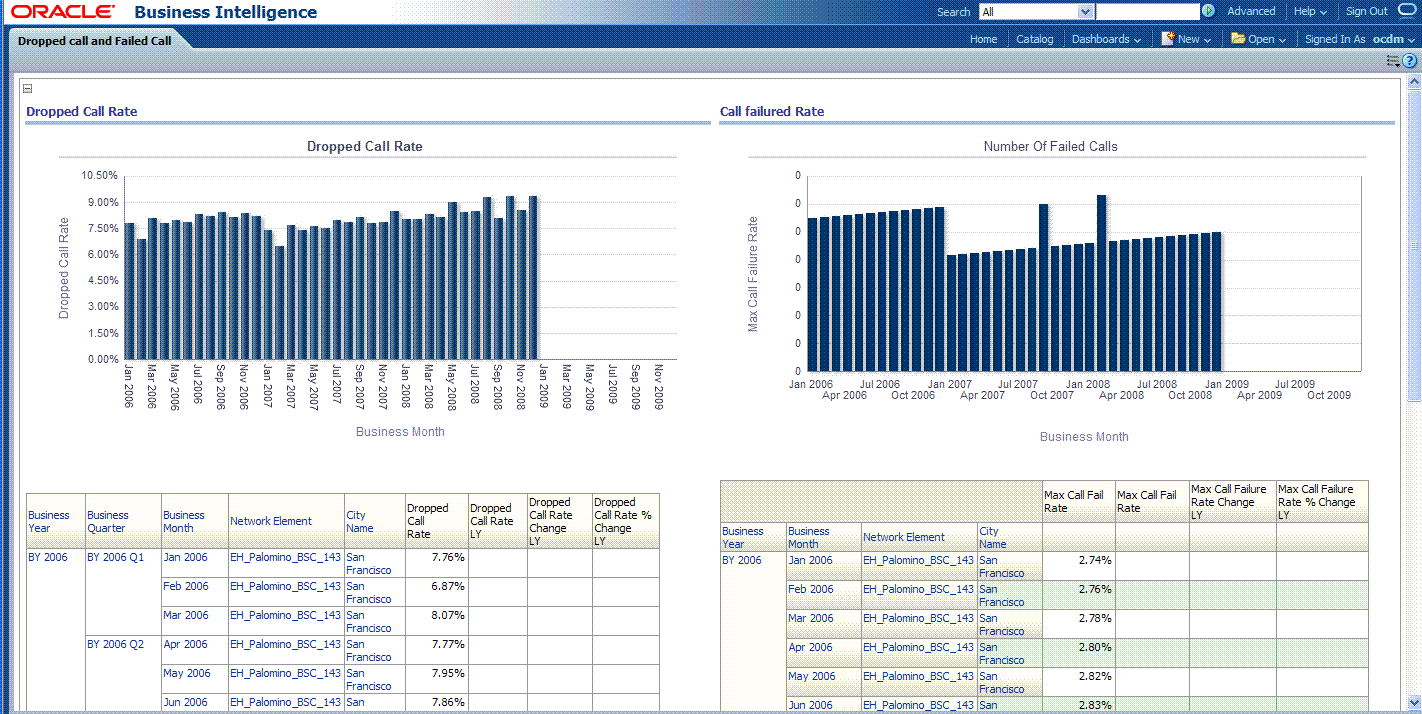
In this example assume that you want to create a dashboard named "Dropped call and Failed Call", and put both "Dropped Call Rate Report" and "Failed Call Rate Report" into this new dashboard.
To create a dashboard, perform the following steps:
-
In the browser, open the login page at
http://servername:9704/analyticswhereservernameis the server on which the webcat is installed. -
Login with username of
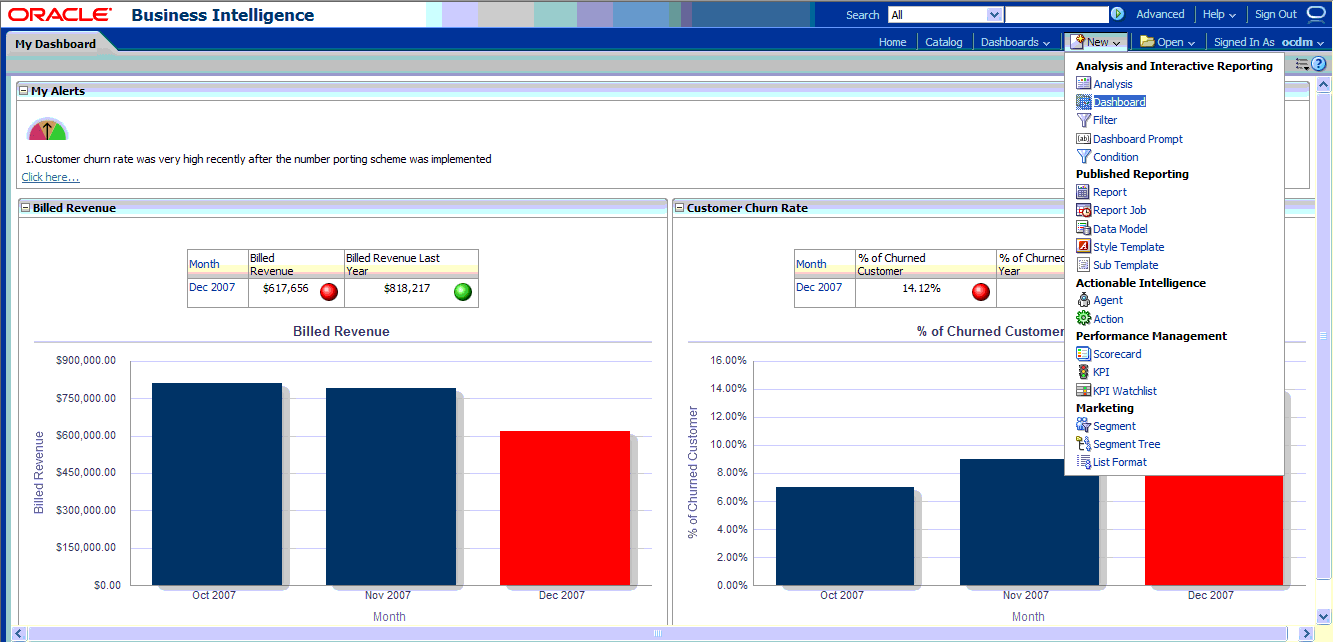
ocdm, and provide the password.Then, click newDashboard to create an Oracle Business Intelligence Suite Extended Edition dashboard.
-
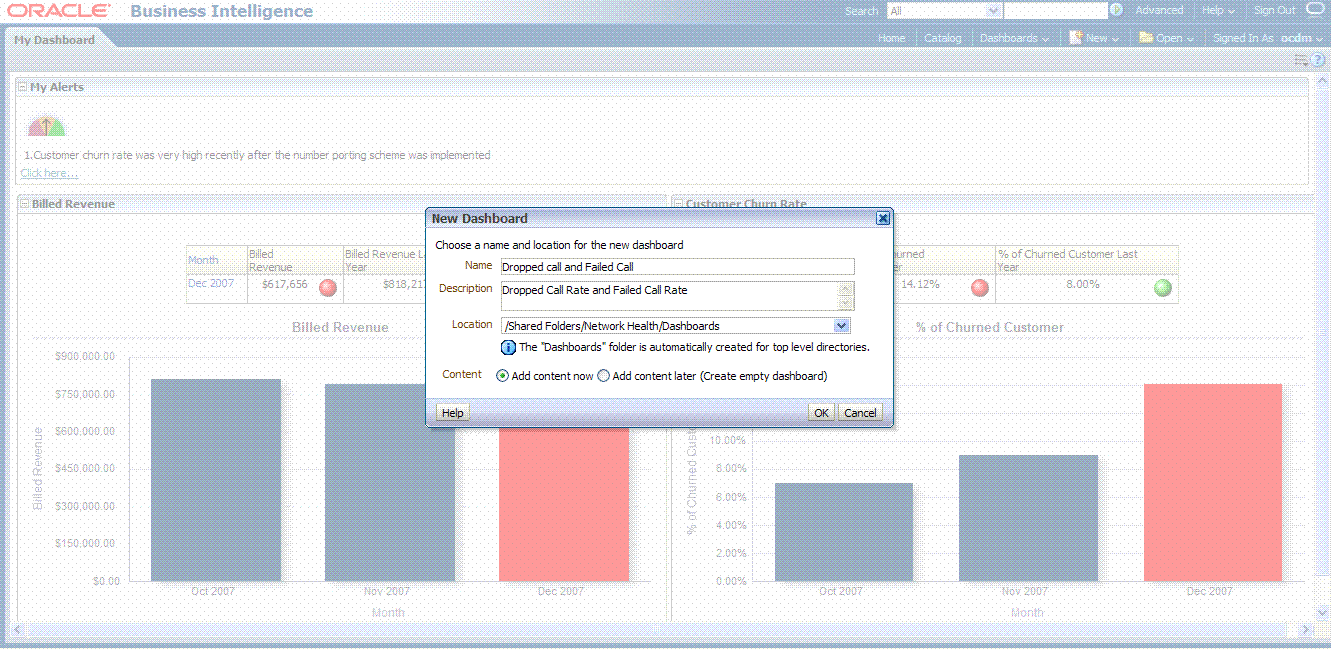
Input name and description, save it to the Network Health folder. Click OK.
-
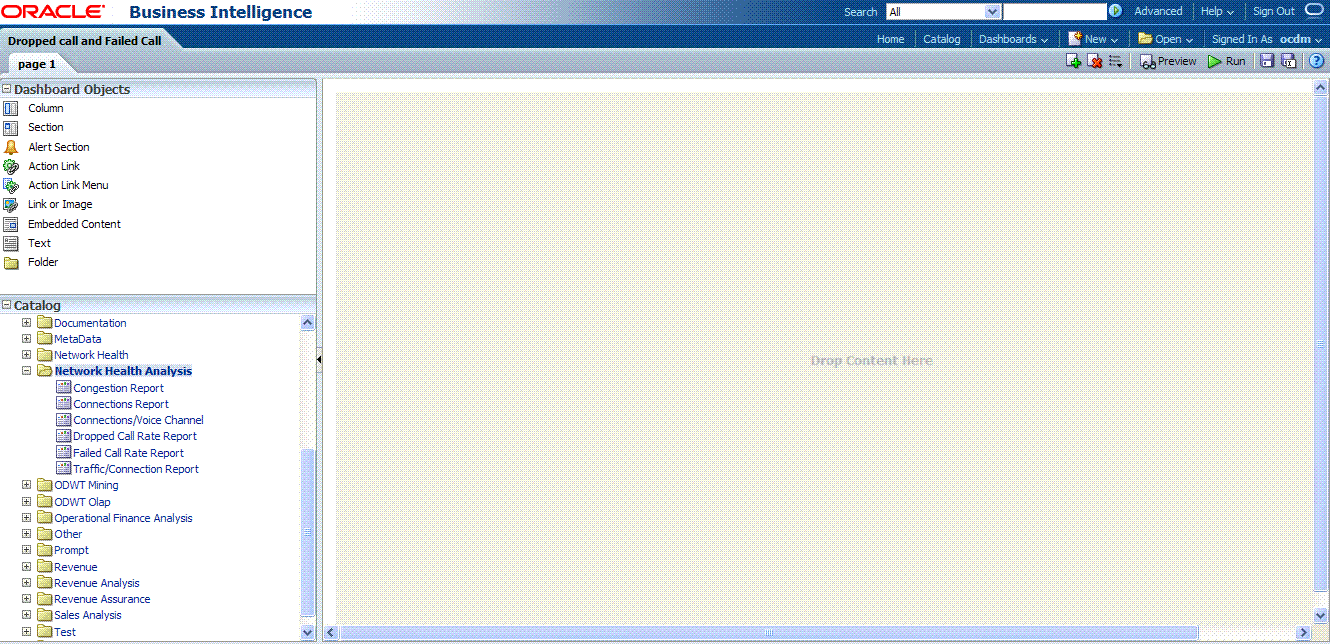
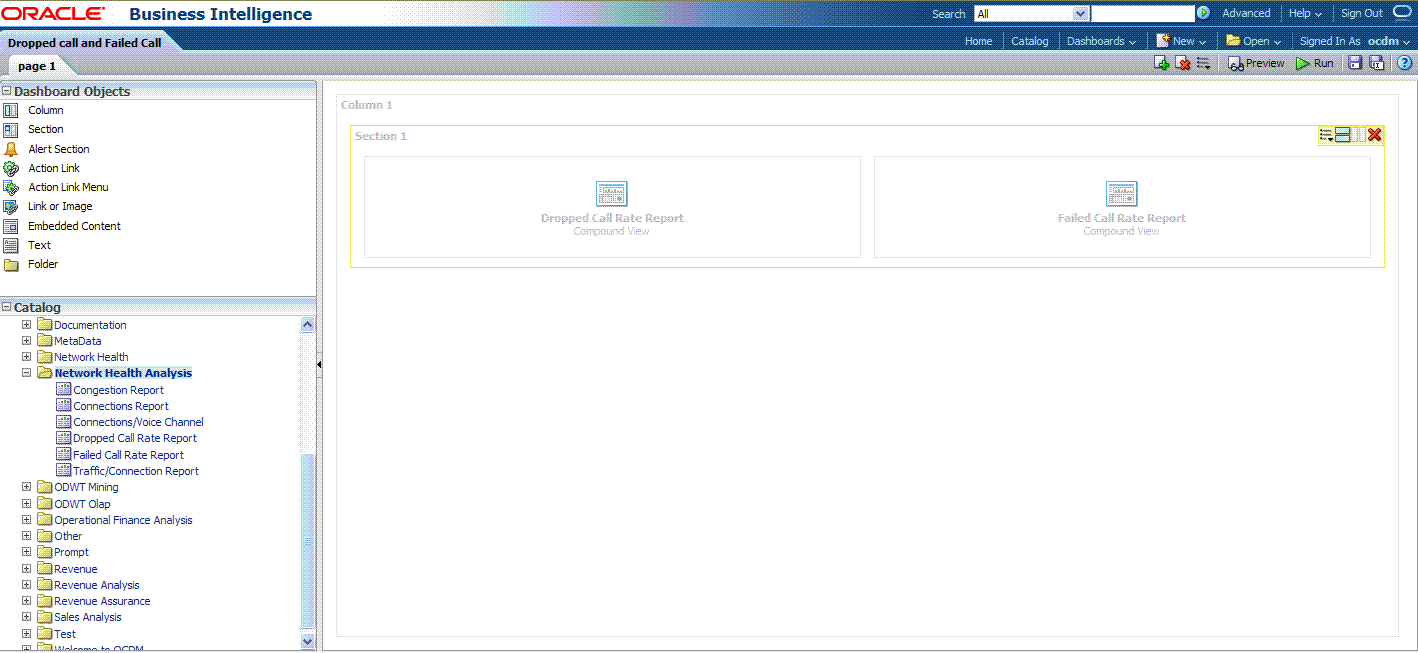
In the Catalog view, expand the Network Health Analysis folder. You can see the Failed Call Rate Report and Dropped Call Rate Report.
-
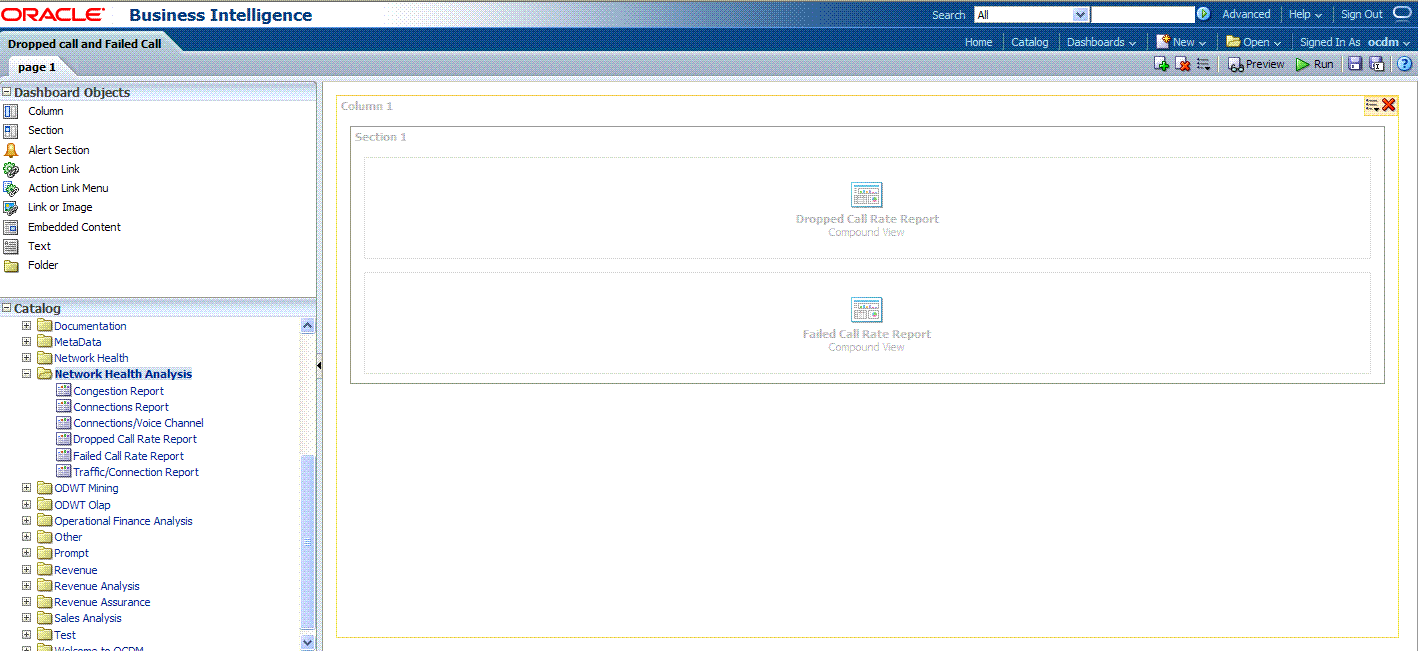
Drag the Failed Call Rate Report and Dropped Call Rate Report from the Catalog view into the right panel.
-
You can change the layout of this section to organize the two reports by horizontal or vertical.
Note that the page name is still "Page1" so you must change it.
-
To change the page name:
-
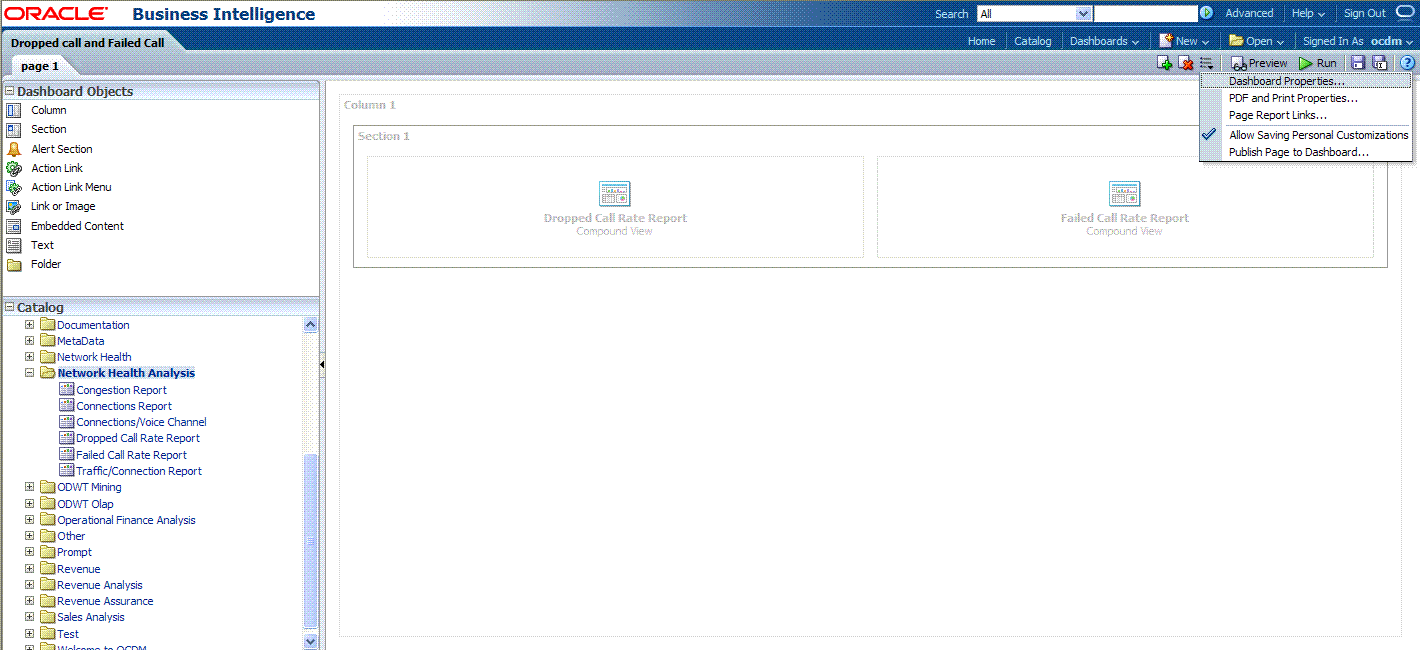
Select the Dashboard.
-
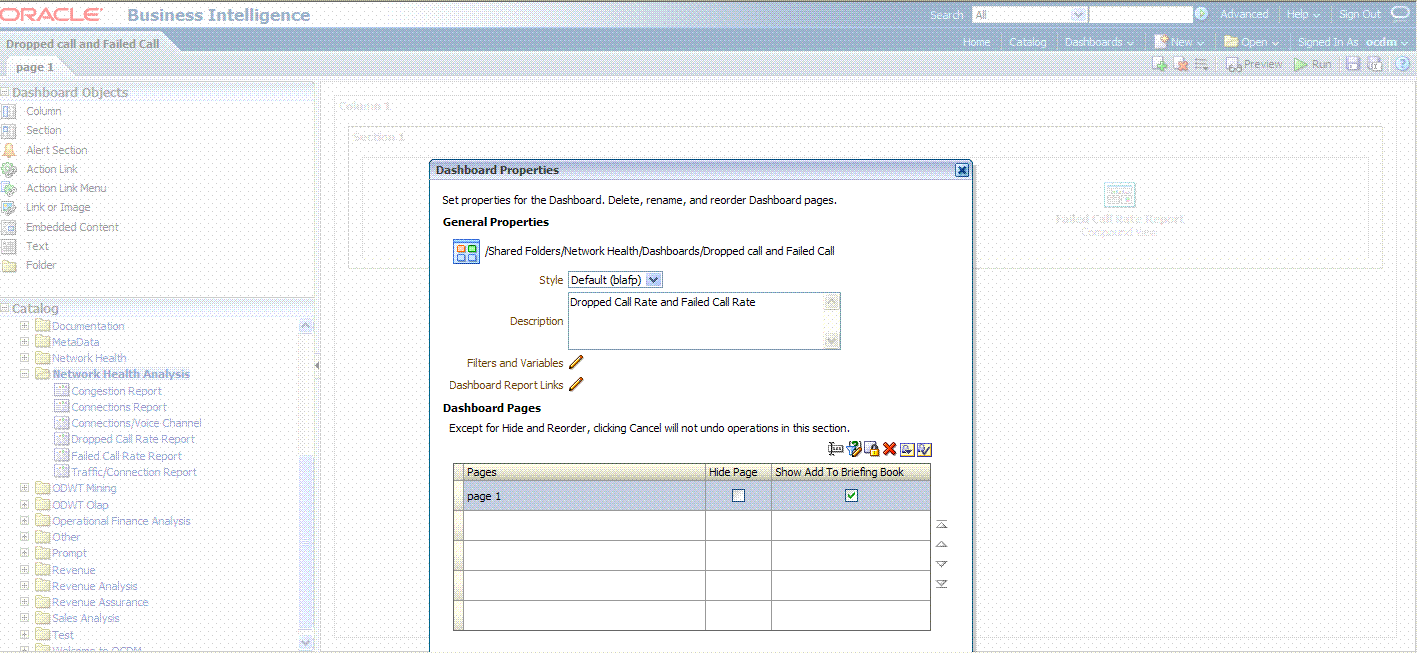
In Dashboard Properties window, click Change Name.
-
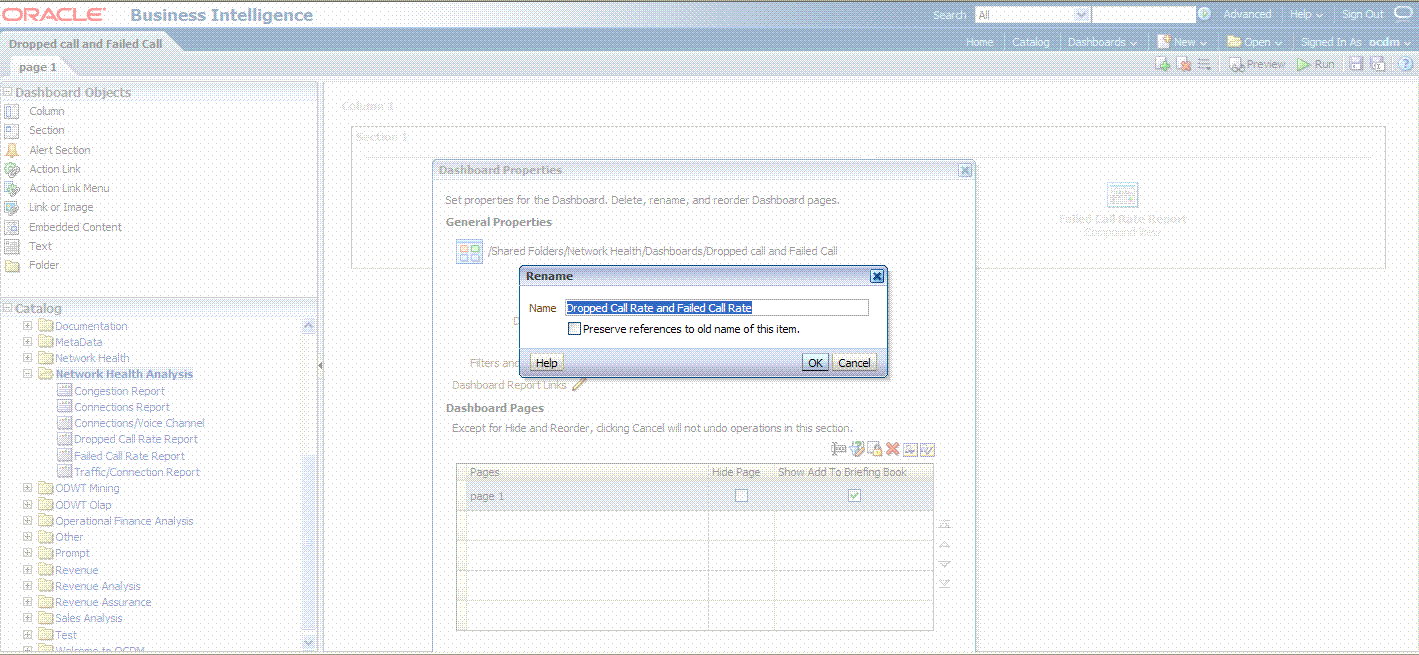
Change the name to "Dropped Call Rate and Failed Call Rate", then click OK.
-
-
Click Save on the top of the dashboard. Now you have a new dashboard.
Note:
For more information on creating dashboards see the "Creating Analyses and Dashboards 11g" OBE tutorial.
To access the tutorial, open the Oracle Learning Library in your browser by following the instructions in "Oracle Technology Network"; and, then, search for the tutorial by name.
Related Topics
