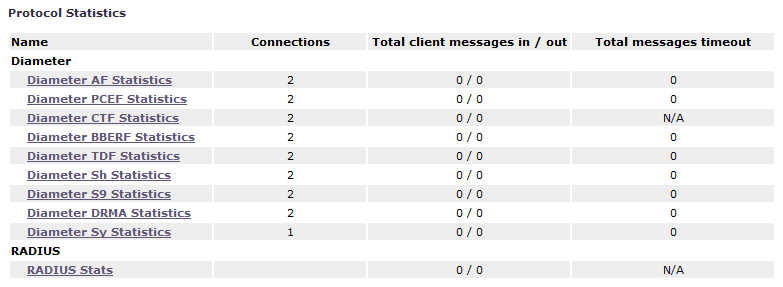
The Protocol Statistics section summarizes the protocol activity within the MPE device. This information is presented as a table of summary statistics for each protocol. Some protocols are broken down into sub-entries to distinguish between the different types of protocol activity.
- Connections
- If the protocol is connection oriented, this value represents the current number of established connections using each protocol.
- Total client messages in / out
- The total number of incoming and outgoing messages received and sent using each protocol.
- Total messages timeout
- The total number of incoming and outgoing messages that timed out using each protocol.
Figure 1 shows a sample.
You can click the name of each entry in the Protocol Statistics table to display a detailed report page. For most protocols, this report page displays a set of counters that break down the protocol activity by message type, message response type, errors, and so on.
Many of the protocol report pages also include a table that summarizes the activity for each client or server with which the MPE device is communicating through that protocol. These tables let you select a specific entry to further examine detailed protocol statistics that are specific to that client or server.
Since many of these statistics contain detailed protocol-specific summaries of information, the specific definitions of the information that is displayed are not included here. For more specific information, see the appropriate technical specification that describes the protocol in which you are interested (see Policy and Protocol Specifications).
- Statistical information is returned from the MPE server as a series of running peg counts. To arrive at interval rate information, such as session success and failure counts, two intervals are needed to perform the difference calculation. Also, statistical information, such as session activation counts, is kept in memory and is therefore not persisted across the cluster. After a failover, non-persistent metrics must be repopulated based on a sampling from the newly active primary server. Therefore, when an MPE server is brought online, or after a failover, one or more sample periods will display no statistical information.
- Historical network element statistical data is inaccurate if configuration values (such as capacity) were changed in the interim. If the network element was renamed in the interim, no historical data is returned.
- RUR_SEND_COUNT
- The number of RUR messages sent.
- RUR_RECV_COUNT
- The number of RUR messages received.
- RUA_SEND_SUCCESS_COUNT
- The number of RUA success messages sent.
- RUA_RECV_SUCCESS_COUNT
- The number of RUA success messages received.
- RUA_SEND_FAILURE_COUNT
- The number of RUA failure messages sent.
- RUA_RECV_FAILURE_COUNT
- The number of RUA failure messages received.
- LNR_SEND_COUNT
- The number of LNR messages sent.
- LNR_RECV_COUNT
- The number of LNR messages received.
- LNA_SEND_SUCCESS_COUNT
- The number of LNA success messages sent.
- LNA_RECV_SUCCESS_COUNT
- The number of LNA success messages received.
- LNA_SEND_FAILURE_COUNT
- The number of LNA failure messages sent.
- LNA_RECV_FAILURE_COUNT
- The number of LNA failure messages received.
- LSR_SEND_COUNT
- The number of LSR messages sent.
- LSR_RECV_COUNT
- The number of LSR messages received.
- LSA_SEND_SUCCESS_COUNT
- The number of LSA success messages sent.
- LSA_RECV_SUCCESS_COUNT
- The number of LSA success messages received.
- LSA_SEND_FAILURE_COUNT
- The number of LSA failure messages sent.
- LSA_RECV_FAILURE_COUNT
- The number of LSA failure messages received.