The Active Alarms summary provides an aggregate view of time stamped alarm notifications for Policy Management systems. The display is refreshed every ten seconds and appears in the upper right corner of all CMP pages. Alarms remain active until they are reset.
The Active Alarms report provides details about active alarms. To view the Active Alarms report:
Figure 1 shows a sample active alarm report.
Sample Active Alarms Report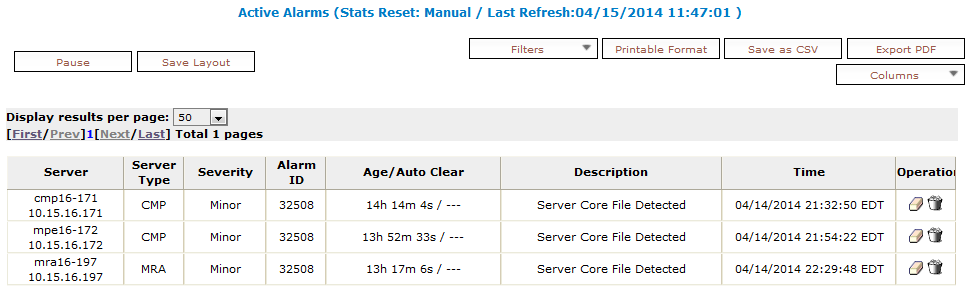
The alarm levels are as follows:
- Critical—Service is being interrupted. (Critical alarms are displayed in red.)
- Major—Service may be interrupted if the issue is not corrected. (Major alarms are displayed in orange.)
- Minor—Non-service affecting fault. (Minor alarms are displayed in yellow.)
Notifications, which have a severity of Info, are not displayed in the Active Alarms report, but are written to the trace log. For more information, see Viewing the Trace Log.
Note: Alarms generated by Policy Management systems running software lower than release 7.5 are mapped to these levels as follows: Emergency or Critical map to Critical; Alert or Error map to Major; Warning or Notice map to Minor.
The Age/Auto Clear column shows how long an alarm has been active (that is, how long since it was raised) and how long the alarm will display before being automatically cleared. The Auto Clear time is shown as --- (three hyphens) if the alarm is not automatically cleared.
The following options are available:
- To sort the report on any column, click the column title.
- To display online help for an alarm, click its ID.
- To hide an alarm, click the hide icon (
 ), located to the right of each row. All instances of alarms with that ID reported from that server are hidden from display (but shown in the Hidden Filter, which you can use to restore the display of those alarms).Note: Hiding an alarm only affects the current user. Other users will see the alarm if they display the Active Alarms page.
 - To manually clear an alarm, click the Clear icon (
 ), located to the right of each row. You are prompted, This alarm will be cleared. Are you sure? Click OK.
 - To pause the display of alarms, click Pause. To resume the display, click Refresh.
- To select what information is displayed, click Columns and select from the list.
- To control what alarms and alarm classes are displayed on the page, click Filters and select from the list:
- The Search Filter tab has three controls. The Server control lets you display alarms from all servers (default) or a specific server. The Server Type control lets you display alarms from all Policy Management products (default) or just CMP, MRA, or MPE systems. The Severity control lets you display alarms of all severities (default), critical and major alarms, critical alarms, major alarms, or minor alarms.
- The Hidden Filter tab shows alarms, by server and alarm ID, that are currently hidden from display. Click , to the right of an entry, to remove it from the list of hidden items and display it in the page again.
- To save your formatting changes to the report page, click Save Layout.
- Printable Format—The current alarms are displayed in a separate window.
- Save as CSV—A comma-separated value (CSV) file named report.csv is generated, suitable for a spreadsheet application, and a standard File Download window opens, so you can save or open the file.
- Export PDF—A Portable Document Format (PDF) file named report.pdf is generated, suitable for a spreadsheet application, and a standard File Download window opens, so you can save or open the file.