To view the connection status report.
- From the System Wide Reports section of the navigation pane, select Others.
- Select Connection Status
Figure 1 shows a sample connection status report.
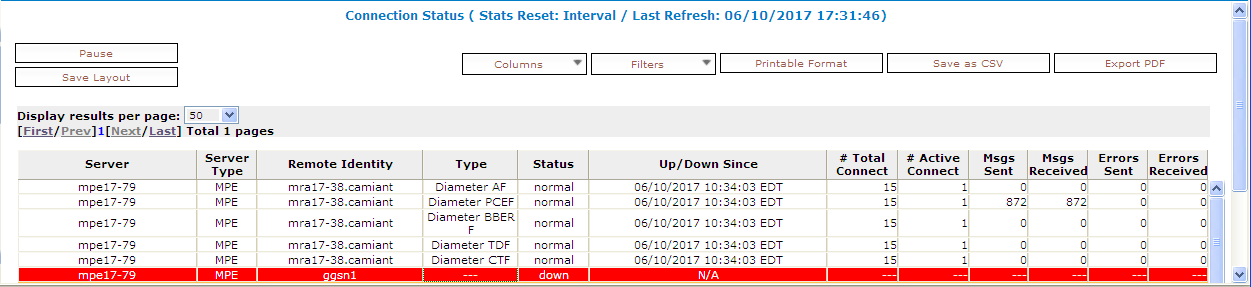
- To sort the report on any column, click the column title.
- To pause the display of connections, click Pause. To resume the display, click Refresh.
- To display another page of the report, click the page number.
- Server
Name of the associated system.
- Server Type
MPE (Multimedia Policy Engine) or MRA.
- Remote Identity
The Diameter ID (if known) or IP address of the remote system.
- Type
The type of connection
- Status
The status of the connection (the possible values are protocol-specific).
- Up/Down Since
The timestamp when the connection reached its current state (N/A if the connection has never been established).
- # Total Connect
The number of times that the connection has been re-established.
Note: This counter is reset if the cluster is restarted. - # Active Connect
The number of active connections.
Note: This counter is reset if the cluster is restarted. - Msgs Sent
The number of Diameter or RADIUS protocol messages that have been sent to the remote system.
- Msgs Received
The number of protocol messages that have been received from the remote system.
- Errors Sent
The number of protocol error messages that have been sent to the remote system.
- Errors Received
The number of protocol error messages that have been received from the remote system.
If a connection is in a non-functional state, the row is displayed in red; if a connection is in a transitional state between functional and non-functional (including when a connection is being established), the row is displayed in yellow.
- Server
Filter in all servers (default) or one specific server.
- Server Type
Filter in all server types (default), totals only, MPE devices only, or MRA devices only.
- Remote Identity
Filter in all remote devices (default) or one specific device.
- Type
Filter in all remote device types (default) or one specific device type: Diameter AF, Diameter PCEF, Diameter BBERF, Diameter TDF, Diameter SH, Diameter CTF, or Diameter DRMA.
- Status
Filter in all remote device status values (default) or one specific status: down, normal, or reopen.
You can save formatting changes to the report page. Click Save Layout.
You can display the report in a format suitable for printing. Click Printable Format; a Connection Status Report window opens.
You can save the report in comma-separated value (CSV) format, suitable for importing into a spreadsheet application. Click Save as CSV. A file named report.csv is generated, and a standard File Download window opens, so you can save or open the file.
You can save the report as a Portable Document Format (PDF) file, suitable for storage or online display. Click Export PDF. A file named report.pdf is generated, and a standard File Download window opens, so you can save or open the file.