Relationship of Parts
This topic discusses the relationship of parts in an analytic model.
The primary parts in an analytic model are data cubes (cubes) and dimensions:
A data cube is like a sheet of paper that contains one and only one kind of data.
When you build an analytic model, you create a data cube for each kind of information in the analytic model. For example, an analytic model of a business might contain a data cube for sales, a data cube for rent, a data cube for salary, and so on.
A dimension contains a list of one kind of data that can span various contexts.
For example, an analytic model of a business might contain the PRODUCT_CODES dimension and the MONTHS dimension. These two dimensions can be used in both a SALES cube collection and a COST_OF_GOODS cube collection to track the products sales and costs over a period of months.
A dimension member (member) is one list item within a dimension.
Maximum Length of Dimension member is 30. Many different kinds of dimension members exist. For example, the 010 product code is a detail member of the PRODUCT_CODES dimension. Western Europe is an aggregate member of the REGIONS dimension.
See Types of Dimension Members.
Note: You do not create dimension members in the analytic model definition. Instead, dimension members are dynamically created during runtime.
Note: The maximum number of dimensions attached to a data cube is 31. The aggregation routines fail if the attached dimensions are greater than 31.
Data cubes and dimensions work together to create the structure of the analytic model. To see how this works, imagine writing SALES at the top of a blank sheet of paper. This is the equivalent of creating a new data cube.
You could write only a single value in the SALES cube, but a cube with only one value is not useful. So your next action is to write a list of months across the top of the cube and a list of product codes down the side of the cube.
Image: SALES data cube with attached PRODUCT_CODES and MONTHS dimensions
This is an example of SALES data cube with attached PRODUCT_CODES and MONTHS dimensions.
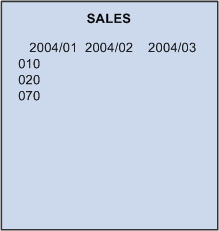
The SALES cube now contains a value for every month and product code because you attached two dimensions to the cube.
Dimensions are separate objects that can be used independently of data cubes. For this reason, even though you originally created the MONTHS and PRODUCTS dimensions for the SALES cube, you can reuse these dimensions with other data cubes. For example, imagine taking a new sheet of paper and writing COST_OF_GOODS at the top of the page, and then attaching the existing dimensions to the new sheet.
Image: Attaching the PRODUCT_CODES and MONTHS dimensions to the COST_OF_GOODS data cube
This is an example of attaching the PRODUCT_CODES and MONTHS dimensions to the COST_OF_GOODS data cube.
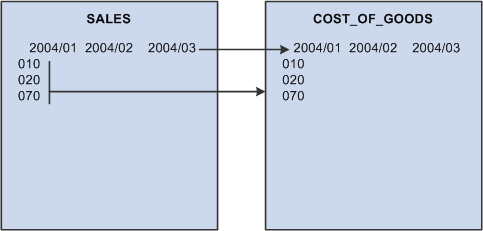
It is tempting to think that the dimensions attached to the COST_OF_GOODS cube are copies of the dimensions on the SALES cube. This might be true on paper, but an analytic model works differently. The dimensions are independent objects that you attach to the data cubes. For this reason, the MONTHS dimension that is attached to the COST_OF_GOODS cube is the same dimension as the MONTHS dimension that is attached to the SALES cube. Therefore, any change that an application makes in a dimension is reflected on all data cubes that use that dimension.
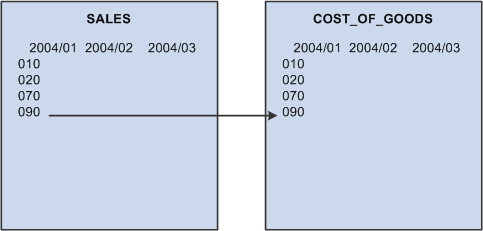
For example, suppose the application adds a product code called 090 to the PRODUCT_CODES dimension on the SALES cube. The analytic model adds 090 to the PRODUCTS dimension on the COST_OF_GOODS cube.
Image: Adding the 090 product code to the PRODUCT_CODES dimension on the SALES cube
This is an example of adding the 090 product code to the PRODUCT_CODES dimension on the SALES cube.
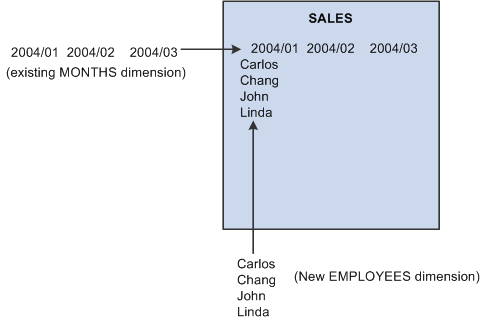
When updating an analytic model, you can use a combination of existing and new dimensions when you define a data cube. For example, suppose you create a cube called SALARY. You want to track monthly data, so you attach the existing MONTHS dimension to the data cube. You also want to track the salary for each employee, so you create a new EMPLOYEES dimension and attach it to the SALARY cube.
Image: SALARY data cube with attached MONTHS dimension and new EMPLOYEES dimension
This is an example of SALARY data cube with attached MONTHS dimension and new EMPLOYEES dimension.
You create formulas to define the relationships among the data cubes in an analytic model. For example, this formula for the GROSS_MARGIN data cube defines the relationship between GROSS_MARGIN and other data cubes called SALES and COST_OF_GOODS:
SALES - COST_OF_GOODSThe analytic calculation engine recalculates the values in the GROSS_MARGIN data cube whenever the end user changes the values in the SALES or COST_OF_GOODS data cubes and saves those changes.
Formulas refer to kinds of information as defined by data cubes. Formulas do not refer to specific values. The relationship between GROSS_MARGIN, SALES, and COST_OF_GOODS remains true regardless of the specific data contained in these data cubes. You can attach new products or months to the data cubes without changing or copying the formula because the relationships between the data cubes have not changed.
User functions serve several purposes. You can create a user function that contains all or part of a formula and apply this user function to calculate multiple data cubes. You can also create user functions to define filter functions and rules for aggregating dimension members.
See Understanding Rules, Formulas, and User Functions, Understanding Dimension Members.
A cube collection is a collection of related data cubes. You create cube collections to load data from the database into the analytic model, save data back to the database, and display calculated data to the end user at runtime. Some cube collections contain data cubes that receive user input, and other cube collections calculate data cubes and display calculated data to the end user.
You can use organizers to arrange an analytic model's parts for more convenient viewing and editing. Within an analytic model, you can place any of the following parts in as many different organizers as you want:
Cube collections.
Data cubes.
Dimensions.
User functions.
Organizers.
You can drag and drop parts into and between organizers, place suborganizers into organizers, and drag and drop organizers and suborganizers to arrange their positions in the Organizers branch of the part browser.