Creating PeopleSoft Charts
This section discusses the process of creating charts using any of the PeopleSoft charting classes. Further details can be found in the specific section for each chart class.
The topics discussed in this section relate to all of the charting classes.
This section summarizes the basic steps to create a chart. The basic steps are essentially the same for all charting classes.
At the end of this chapter are examples of charts with step-by-step instructions and complete PeopleCode programs.
The Chart class section has fundamental, detailed instructions for creating a chart using the Chart class. Each specialized class – Gantt class, OrgChart class, and RatingBoxChart class – has detailed instructions that build on the Chart class instructions.
Note: The following steps are for creating a chart on a PeopleSoft application page. You can also create a chart for a web page using an iScript. Only Chart class charts can be created using an iScript.
See Creating a Chart Using an iScript.
To create a chart on a page:
In Application Designer, place a chart control on a page and associate the chart with a record field.
Create a record to hold your chart data.
For charts made using the OrgChart class and the RatingBoxChart class, you also create a record that controls the appearance of the chart. Place each record on a level-1 grid on the page so the chart records are present in the component buffer at runtime. You can optionally hide the grid. You can also optionally place the grid on another page on the same component.
Place the page on a component and register the component.
Add PeopleCode, probably on the page Activate event, to instantiate the chart object and associate it with the page control.
For example, this is the minimum PeopleCode to create a bar chart using the Chart class.
/* Declare and instantiate a chart object; */
Component Chart &cChart11;
&cChart11 = GetChart(DOC_CHRT_WRK.DOC_CHRT_FLD_11);

/* Set the chart data record and specify x-axis, y-axis, and series data; */

&cChart11.SetData(Record.DOC_CHRT_SLS_2);
&cChart11.SetDataXAxis(DOC_CHRT_SLS_2.DOC_CHRT_RGN);
&cChart11.SetDataYAxis(DOC_CHRT_SLS_2.DOC_CHRT_SALES);
View the chart in the browser.
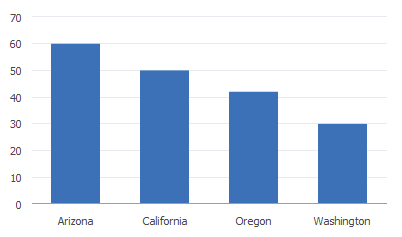
Suppose you have this data in DOC_CHRT_SLSREC:
Region
Sales
Arizona
62
California
50
Oregon
42
Washington
50
This is the bar chart generated by the example code and data. The default chart type for the Chart class is a bar chart. Since no colors are specified, the chart uses the default colors.
Image: A simple bar chart
This example illustrates a simple bar chart:
Add PeopleCode to control the behavior of the chart or to modify its appearance at runtime. For example, for a bar chart you might add FieldChange PeopleCode to the y-axis field on your data record to display information when a user clicks a data point.
See “Adding Drilldown” in Creating a Chart Using the Chart Class.
You can also add FieldChange PeopleCode to a Gantt chart, organization chart, or rating box chart to enable the user to interact with the chart.
If possible, you should put a chart on a page definition. If not possible, then you can build a chart at runtime using an iScript and call the chart using a URL. Use the CreateObject function in the iScript instead of the GetChart function. You can then use the GetChartURL Response class method to use the URL in your application.
Note: You can create only Chart class charts using an iScript. Any charts created using an iScript have limited functionality as compared to charts defined using the Application Designer chart control. Notably, neither interactivity (the charts will be static) nor animations are available.
Gauge chart classes, Gantt class, OrgChart class, and RatingBoxChart class charts cannot be created with an iScript.
For example, this PeopleCode would build a chart using a standalone rowset:
Function IScript_GetChartURL()
local object &MYCHART;
local string &MYURL;

&MYCHART = CreateObject("Chart");
&MYCHART.SetData(xx);

/* xx will be a data row set */

&MYURL = %Response.GetChartURL(&MYCHART);

/* use &MYURL in your application */
...
End-Function;