Viewing the Web Server Dashboard
Access the Web Server dashboard. (On the Application dashboard, click the PIA domain.)
PeopleTools 8.55 supports PIA deployed on WebLogic only. The Web Server dashboard represents a single WebLogic server.
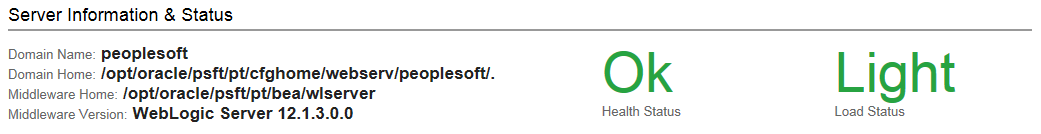
The Server Information and Status section of the dashboard provides details of the domain.
Image: Server Information and Status section
This example illustrates the fields on the Server Information and Status section. You can find definitions for the fields later on this page.
|
Field or Control |
Definition |
|---|---|
| Domain Name |
The name of the WebLogic domain. |
| Domain Home |
The location of the domain. |
| Middleware Home |
The location of the web server. |
| Middleware Version |
The version of the web server. |
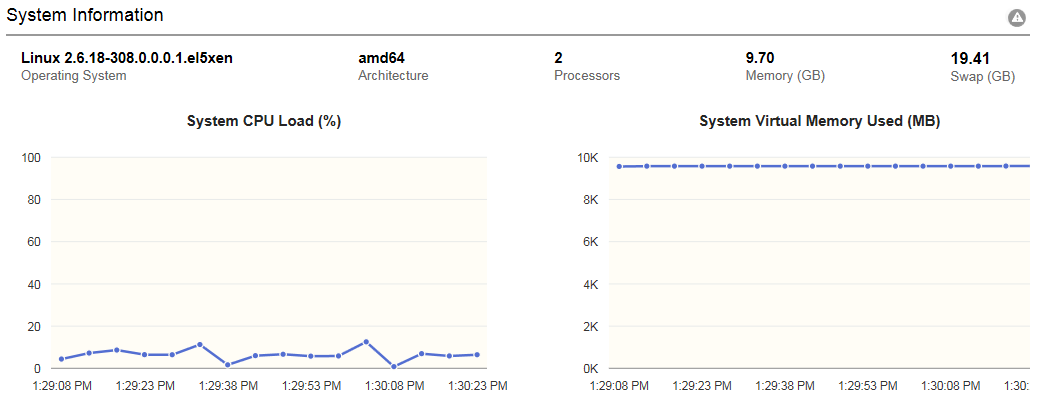
The System Information section of the dashboard provides basic information of the host machine including histograms for total CPU usage and total virtual memory utilization.
Image: System Information section
This example illustrates the fields on the System Information section. You can find definitions for the fields later on this page.
|
Field or Control |
Definition |
|---|---|
 Alert Setup Alert Setup |
Enables you to set up metric alerts. Note: The metric alert setup page is available only for graphs. |
| Operating System |
The operating system make and version. |
| Architecture |
The machine architecture. |
| Processors |
The number of available processors on the machine. |
| Memory |
The total amount of virtual memory (in GB) available on the machine. |
| Swap |
The total amount of swap space (in GB) available on the machine. |
The JVM Heap section of the dashboard displays statistics about the JVM heap and garbage collection.
Image: JVM Heap section
This example illustrates the fields on the JVM Heap section. You can find definitions for the fields later on this page.
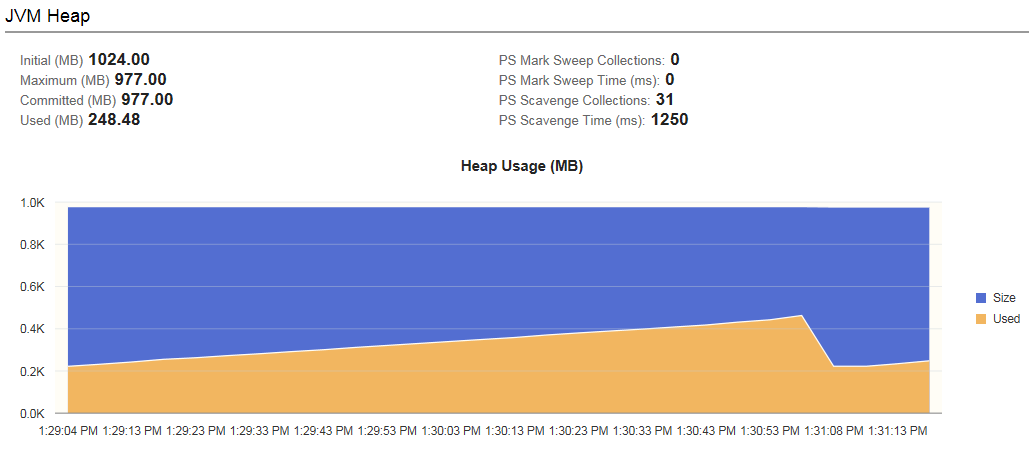
The plot provides a visualization of memory currently allocated for the heap (Committed) and memory currently in use by JVM (Used).
|
Field or Control |
Definition |
|---|---|
| Initial |
The amount of memory (in MB) allocated for the heap when JVM started. |
| Maximum |
The maximum amount of memory (in MB) allocated for the heap. |
| Committed |
Memory (in MB) currently allocated for the heap. |
| Used |
The amount of heap memory (in MB) currently in use by JVM. Note: If the JVM heap usage is very high or the number of rejected requests is high, there may be too much traffic directed to the Web server instance. To resolve, add more Web servers either on the same host, if the host can handle more load, or on a different host that can accommodate the load. |
| PS Mark Sweep Collections |
The number of collections performed by the PS Mark Sweep collector. |
| PS Mark Sweep Time |
The total time (in milliseconds) spent across all PS Mark Sweep collections. |
| PS Scavenge Collections |
The number of collection performed by the PS Scavenge collector. |
| PS Scavenge Time |
The total time (in milliseconds) spent across all PS Scavenge collections. |
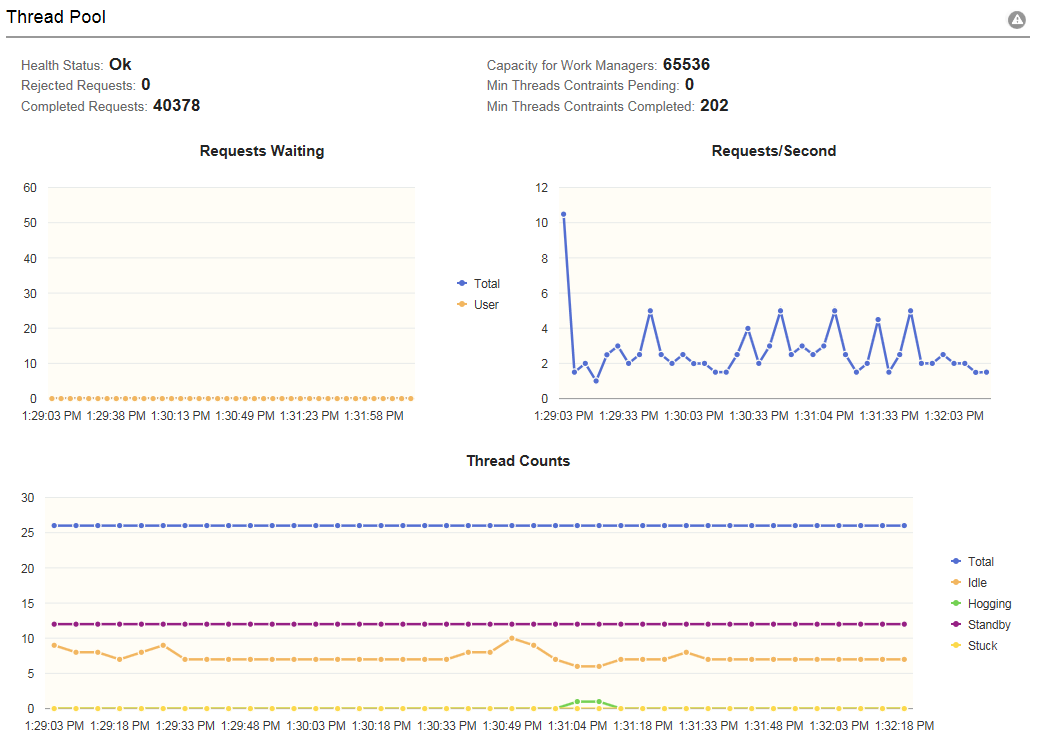
The Thread Pool section of the dashboard provides details and visualizations of the web servers pool of execute threads.
Image: Thread Pool section
This example illustrates the fields on the Thread Pool section. You can find definitions for the fields later on this page.
|
Field or Control |
Definition |
|---|---|
| Health Status |
In WebLogic, the thread pool is a subsystem that maintains its own health status indicator, so the status is sourced from WebLogic Mbeans. |
| Rejected Requests |
The number of requests rejected when no more requests can be accepted because the maximum shared capacity of work managers is utilized. |
| Completed Requests |
The number of completed requests in the priority queue. |
| Capacity For Work Managers |
The maximum number of requests that can be accepted in the priority queue. |
| Min Threads Constraints Pending |
The number of requests that should be executed to satisfy the minimum threads requirement. |
| Min Threads Constraints Completed |
The number of requests with minimum threads constraint picked up out of order for immediate execution because their minimum threads requirement was not met. |
| Requests Waiting Total |
The number of pending requests in the priority queue. This is the total of internal system requests and user requests. |
| Requests Waiting User |
The number of pending user requests in the priority queue. The priority queue contains requests from internal subsystems and users. This value is the count of all user requests. |
| Requests/Second |
The mean number of requests completed per second. |
| Thread Counts |
|
The following table lists the symptoms and causes for threads to be in stuck or hogging state, and their possible resolutions:
|
Symptom |
Cause |
Resolution |
|---|---|---|
|
The threads involve PIA processing and the threads are stuck in Jolt calls in successive thread-dumps. |
The application server is taking too long to process the requests. |
Investigate the performance of those requests on the application server. |
|
The threads are stuck in outbound HTTP requests. |
The HTTP requests is taking too long to process or, in some case, it is due to incorrect network configuration. |
Investigate whether the response is slow due to internal traffic congestion or requests are taking too long to complete on the server. |
|
The thread (either a Web server thread or PIA-related thread) has high CPU usage. |
Check if the server is overwhelmed with too many requests. If so, add more servers. If high CPU usage continues, observe if specific requests cause the high CPU usage. Periodic thread-dumps may help get insight into what processing is taking more CPU time. |
Check Oracle support knowledge base if there is any known case of high CPU usage for the particular release of application being used. If the issue cannot be resolved, contact Oracle Support for assistance. |
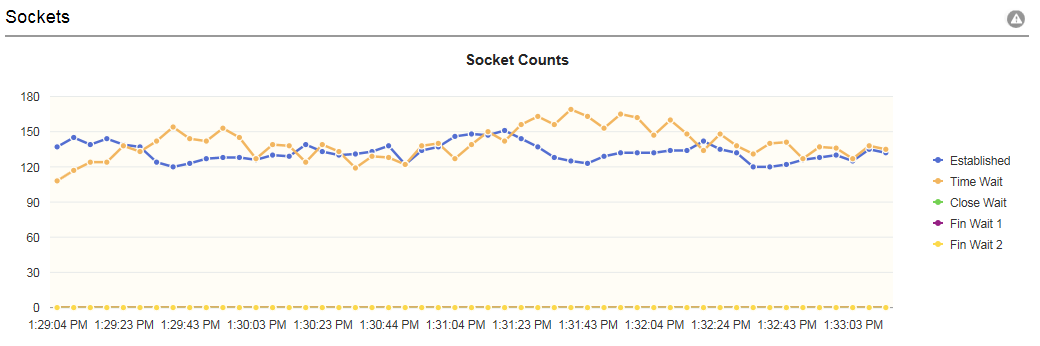
The TCP Sockets section of the dashboard displays count of sockets in various TCP-socket states.
Image: Sockets section
This example illustrates the fields on the Sockets section. You can find definitions for the fields later on this page.
|
Field or Control |
Definition |
|---|---|
| Established |
The "steady state" of an open TCP connection. Data can be exchanged freely when both devices in the connection enter this state. This will continue until the connection is closed for one reason or another. |
| Time Wait |
The device has received a close request from the other device. It must now wait for the application on the local device to acknowledge this request and generate a matching request. |
| Close Wait |
The device has received a termination request from the other device and acknowledged it, and sent its own termination request and received an acknowledgment for it. |
| Fin Wait 1 |
A device in this state is waiting for an acknowledgement for a close request it has sent, or is waiting for a connection termination request from the other device. |
| Fin Wait 2 |
A device in this state has received an acknowledgement for its request to terminate the connection and is now waiting for a matching request to terminate from the other device. |
The following table lists the issues that can happen at various TCP-socket states, and their resolutions:
|
Symptom |
Cause |
Resolution |
|---|---|---|
|
Connections are in TIME_WAIT state for more than five minutes. |
TIME_WAIT interval is too high. It should not be more than thirty seconds. |
Reduce the TIME_WAIT interval. SeePeopleTools Performance Guidelines Red Paper (Doc ID 747389.1), Reviewing TCP Sockets Information. |
|
Socket connections (1000 or more) are stuck in the CLOSE_WAIT state for a long time. |
Sockets are not being closed properly by some applications. |
Determine which process
or processes are leaving the sockets in CLOSE_WAIT state. You can
check The workaround is to increase the user limit for file-descriptor count. |
|
Too many socket connections and requests are being rejected. Note: If requests are being rejected due to other causes, then add additional Web server on another host. |
File-descriptor count is low (less than 8000). |
Increase the count. |
|
File-descriptor count is sufficiently high. |
Investigate and find the requests that are leaving socket connections open. |
For information on the log files section of the dashboard, see Viewing Log Files.
Access the Alert Setup page. (On a dashboard, click the Alert Setup icon.)
PeopleSoft Health Center provides metric alerts that are associated with graphs. You can configure these metric alerts using the Alert Setup icon that is available on the header of a dashboard section associated with a graph.
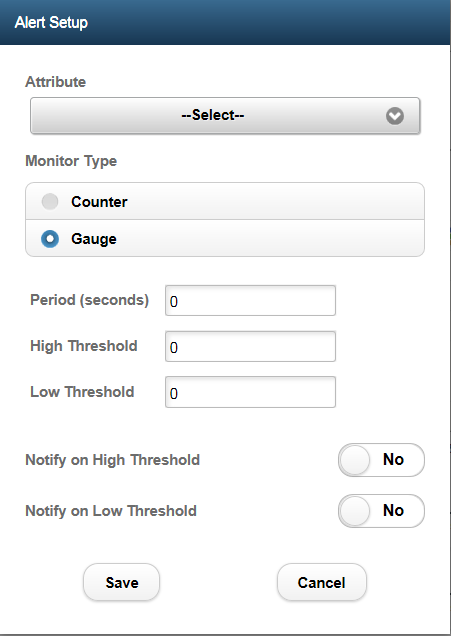
Image: Alert Setup page
This example illustrates the fields and controls on the Alert Setup page. You can find definitions for the fields and controls later on this page.
|
Field or Control |
Definition |
|---|---|
| Attribute |
Displays context-based attribute options. |
| Monitor Type |
Health Center supports two monitoring types:
Gauge monitor is the default. |
| Period (seconds) |
The observed attribute is monitored at intervals specified by the granularity period. |
| High Threshold |
This field is available when you select the Gauge monitor type. When you select the Gauge monitor type, you can set a high threshold value. When the high threshold value is exceeded, an alert is generated if you set the Notify on High Threshold field to Yes. Subsequently, if the high threshold value is exceeded again, an alert is not generated until the low threshold value is crossed. |
| Low Threshold |
This field is available when you select the Gauge monitor type. When you select the Gauge monitor type, you can set a low threshold value. When the low threshold value is crossed, an alert is generated if you set the Notify on Low Threshold field to Yes. Subsequently, if the low threshold value is crossed again, an alert is not generated until the high threshold value is exceeded. |
| Notify on High Threshold |
This field is available when you select the Gauge monitor type. Set to Yes if you want an alert to be generated when the high threshold value is exceeded. |
| Notify on Low Threshold |
This field is available when you select the Gauge monitor type. Set to Yes if you want an alert to be generated when the low threshold value is crossed. |
| Initial Threshold |
This field is available when you select the Counter monitor type. Set a threshold value. When the threshold value is exceeded, an alert is generated if you select Yes for the Notify field. |
| Modulus |
This field is available when you select the Counter monitor type. If the counter can wrap around its maximum value, the modulus needs to be specified. The modulus is the value at which the counter is reset to zero. |
| Offset |
This field is available when you select the Counter monitor type. Specify an offset value. The offset value works in conjunction with the threshold value. When an observed value exceeds its threshold, the threshold value is incremented by the offset, or by a multiple of the offset sufficient to make the threshold greater than the new observed value. |
| Notify |
This field is available when you select the Counter monitor type. Set to Yes if you want an alert to be generated when the threshold value is exceeded. |