Example: Configuring Related Content and Using Simplified Analytic Reports
Image: Supplier Watch fluid component
This example illustrates the Supplier Watch application page. Initially, the Simplified Analytics feature is not enabled, so the My Analytics section is not available in the right panel.
In this example, you will:
View the settings of an existing Pivot Grid model (PO_NONCNTRCT_SPEND) that will be associated as the base template model for the component.
Note that:
Any Pivot Grid model in the database can be associated with the component as an analytic report template. However, instead of using an existing model in the database as described in this example, you can also create a new Pivot Grid model and then associate that model to the component as analytic report template.
No special setting is required in the Pivot Grid model to use it as a base template.
Create an analytic report template by configuring related content references to associate the existing Pivot Grid model to the Supplier Watch List page (PO_SWL_WATCH_FL).
As an administrator, create an analytic report based on the analytic report template that you just created and then publish the newly created analytic report to all users.
Log in as an application user, view the analytic report, and then create a new analytic report based on the template.
Note: The query behind the analytics template model should not use the same select field as a prompt or use the same select field as part of an expression that is used in the query criteria because the simplified analytics can create an error when that dimension is dragged as a fact while creating the analytic report.
To view the configurations of an existing Pivot Grid model that will be associated to the analytic report template:
Select Reporting Tools, Pivot Grid, Pivot Grid Wizard.
Search for and select the PO_NONCNTRCT_SPEND model.
Use the Specify Pivot Grid Properties page to view the name and add or change the title or description of the model.
Click the Next button to access the Select Data Source page, where you can view or update the data source and output columns of the model.
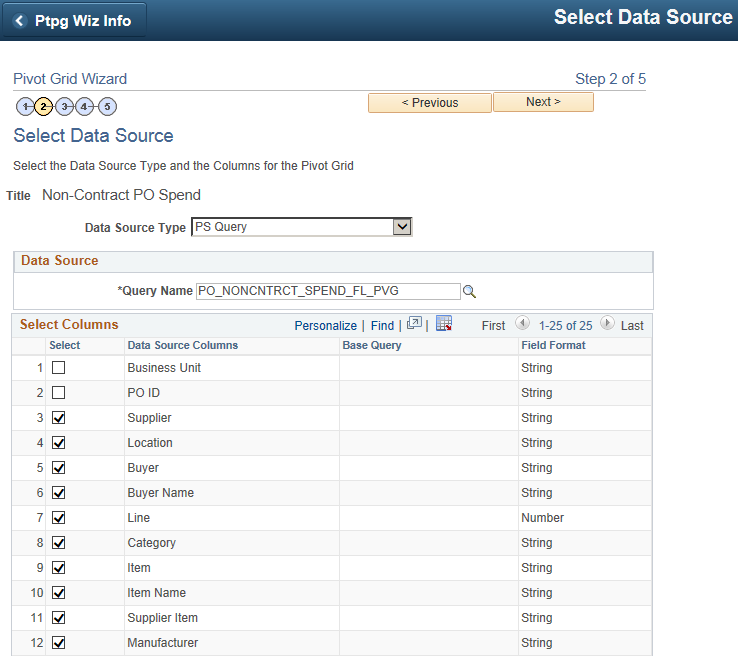
Image: Select Data Source page
This example illustrates the Select Data Source page displaying the data source and output columns of the PO_NONCNTRCT_SPEND model.
Click the Next button to access the Specify Data Model Values page, where you can view or update the settings of columns, aggregate functions, facets, tree options, formatting options, and so on.
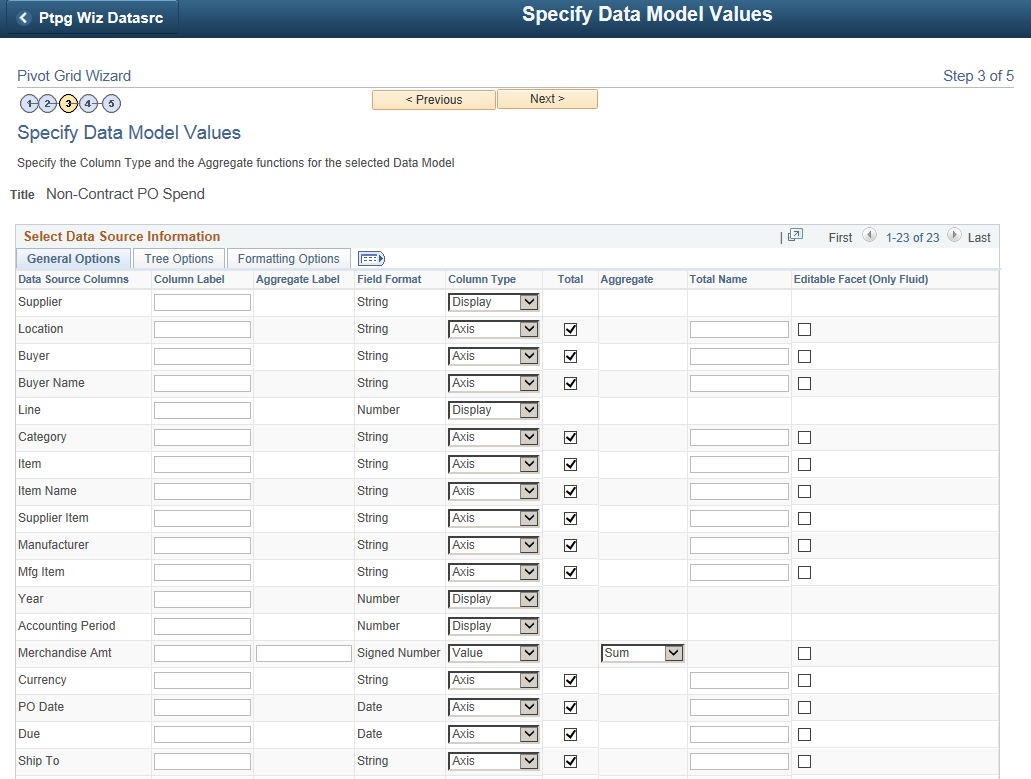
Image: Specify Data Model Values page
This example illustrates the Specify Data Model Values page displaying the settings of the data source in the PO_NONCNTRCT_SPEND model.
Click the Next button to access the Specify Data Model Options page, where you can view the initial layout of the grid and the chart.
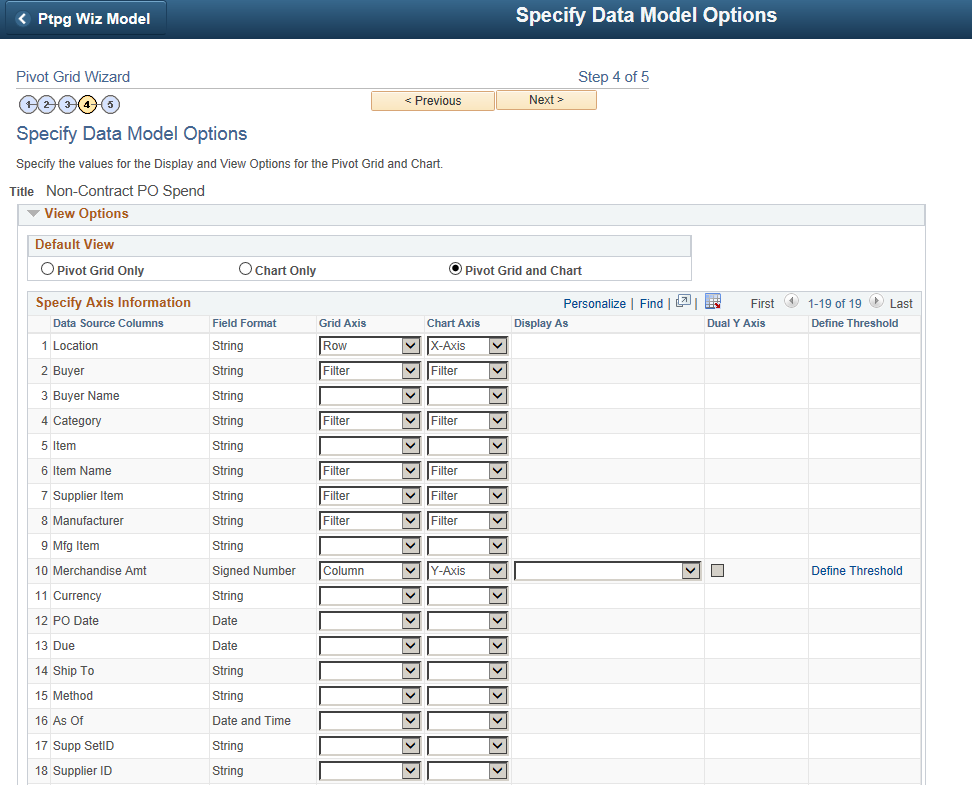
Image: Specify Data Model Options page
This example illustrates the Specify Data Model Options page displaying the settings of the grid and chart for the PO_NONCNTRCT_SPEND model.
Scroll down and expand the Fluid Mode Options section.
Image: Specify Data Model Options page - Fluid Mode Options section
This example illustrates the Specify Data Model Options page - Fluid Mode Options section.
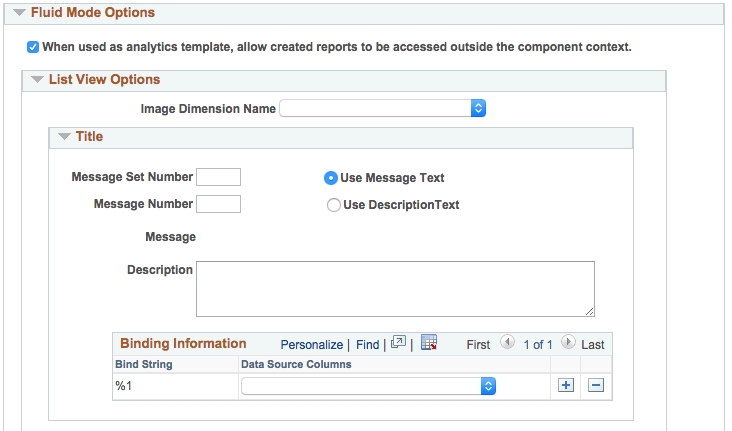
Note the When used as analytics template, allow created reports to be accessed outside the component context option:
If this option is selected, the analytic reports that are created using the Create Analytics Wizard are not restricted, and these reports can be accessed from outside the component context.
If this option is deselected, the analytic reports that are created using the Create Analytics Wizard are restricted to be accessed within the component.
See Security Considerations When Using Simplified Analytics.
Accept all default settings in the PO_NONCNTRCT_SPEND report without any modification.
To associate the Pivot Grid template to a component using related content:
Select PeopleTools, Portal, Related Content Services, Manage Related Content Service.
Click the Assign Related Content to an Application Page link.
In the Select a Content Reference page, select the Include Hidden Crefs option.
Image: Select a Content Reference page
This example illustrates the fields and controls on the Select a Content Reference page.
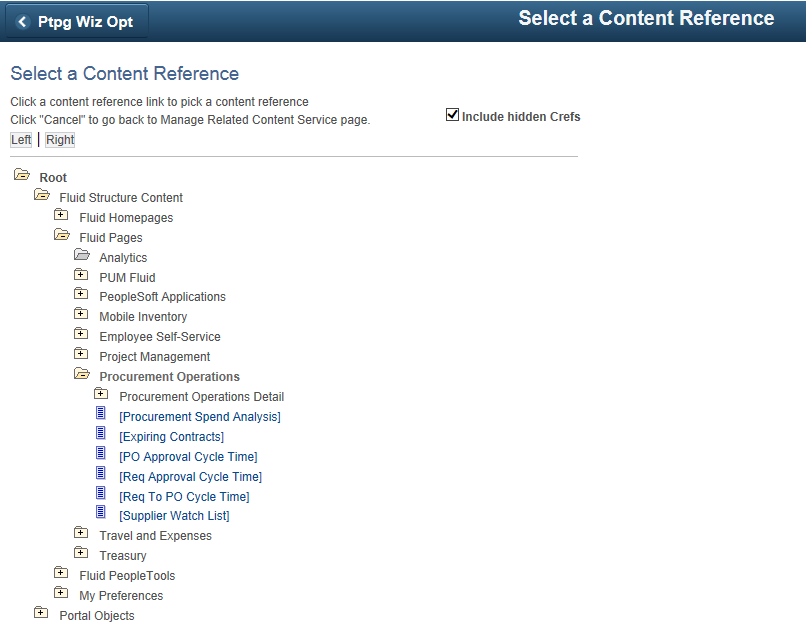
Select the content reference that you want to enable the Simplified Analytics feature.
In this example, you select the Supplier Watch List application page under the Procurement Operations fluid component.
Note: The association must be defined for CREF definitions pointing to the component. The association should not be defined on the content reference links.
Simplified Analytics is only available for the fluid components.
Image: Assign Related Content page
This example illustrates the fields and controls on the Assign Related Content page that appears after you select a fluid page from the Select a Content Reference page. The selected Supplier Watch List page appears as a link in the Content Reference field.
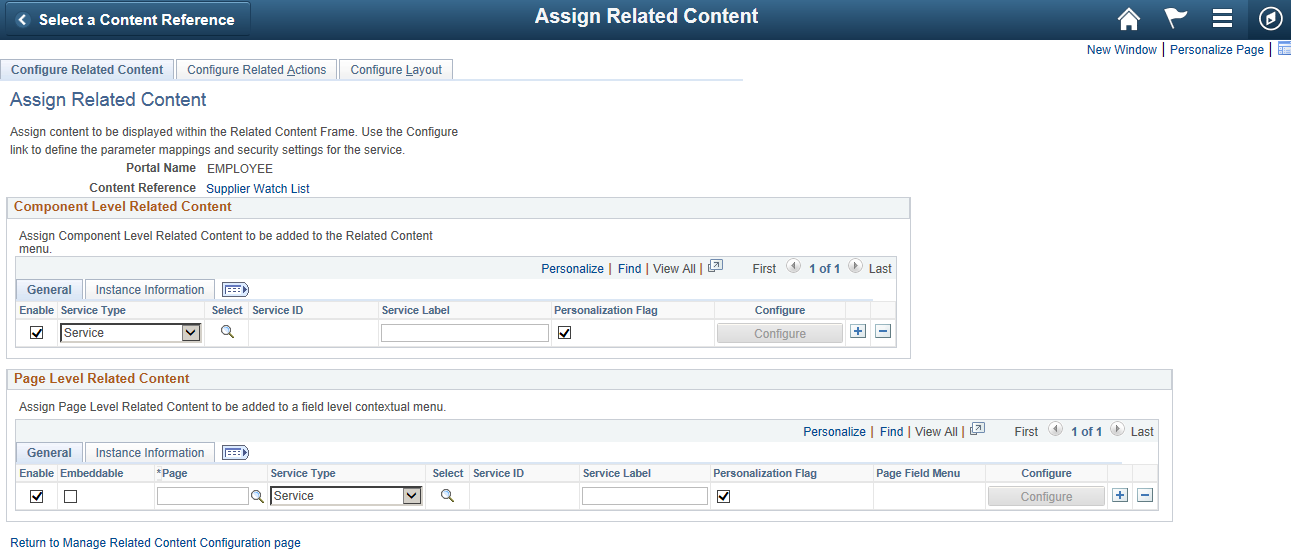
To assign a page in the component that you want to associate the Simplified Analytics feature, use the Page search icon in the Page Level Related Content section to search for and select a page from the list of available pages.
In this example, select the PO_SWL_WATCH_FL page. This page determines the page fields for the mapping.
Note: The Simplified Analytics templates must be associated at the Page Level Related Content section.
Image: Look Up Page
In this example illustrates the Look Up Page.
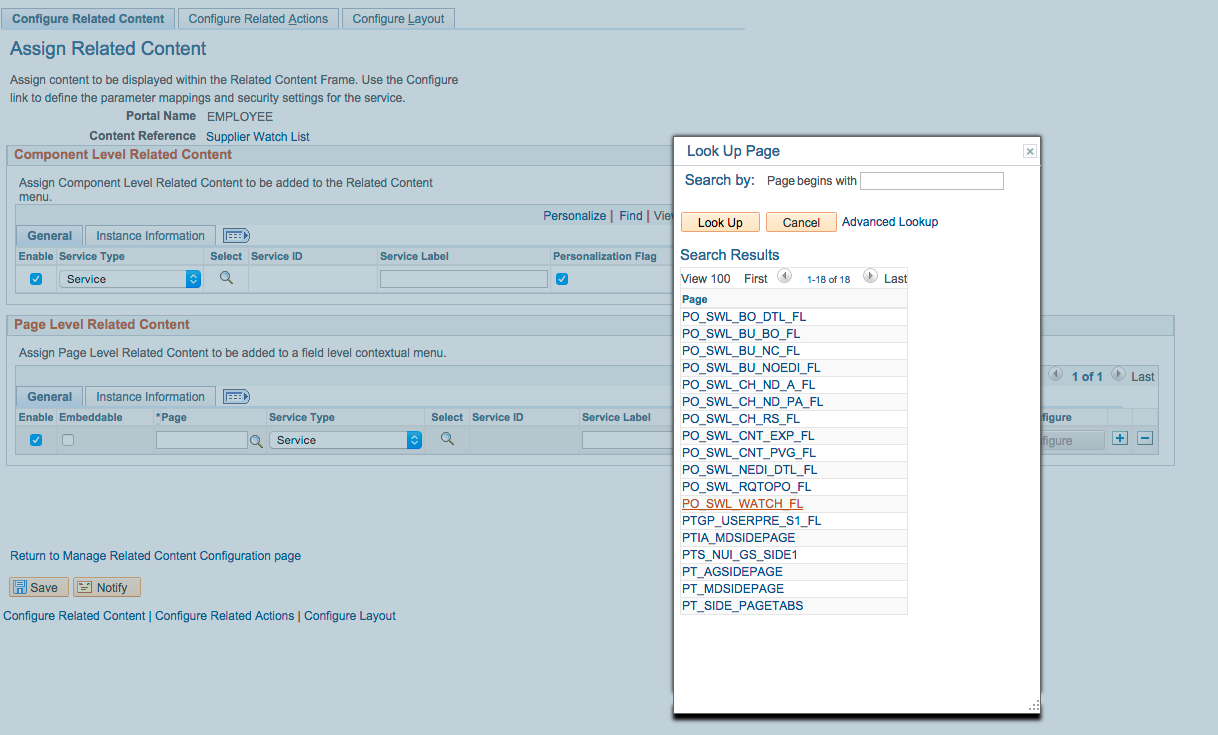
Click the Select search icon in the Page Level Related Content section to display the Look Up Service ID page.
Image: Look Up Service ID page
This example illustrates the Look Up Service ID page. The Simplified Analytics feature must use the service ID ANALYTICSERVICE, which associates a page to the analytic report template.
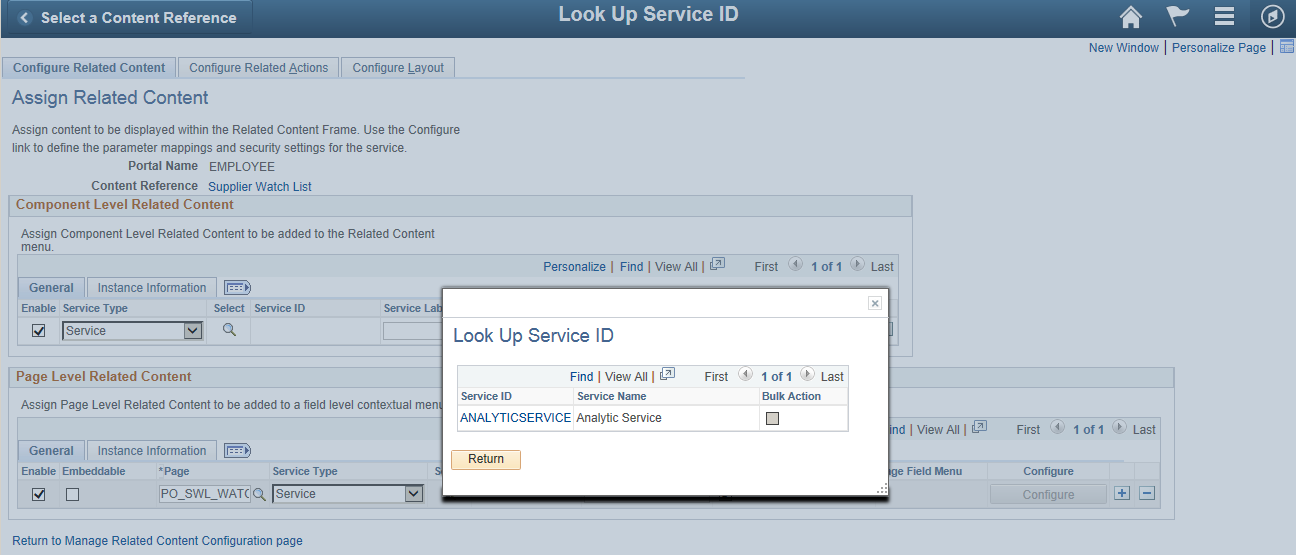
Click the ANALYTICSERVICE link in the Service ID list to display the Choose Pivot Grid page.
Image: Choose Pivot Grid page
This example illustrates the Choose Pivot Grid page listing the available Pivot Grid models that you can use as the base analytic report template.
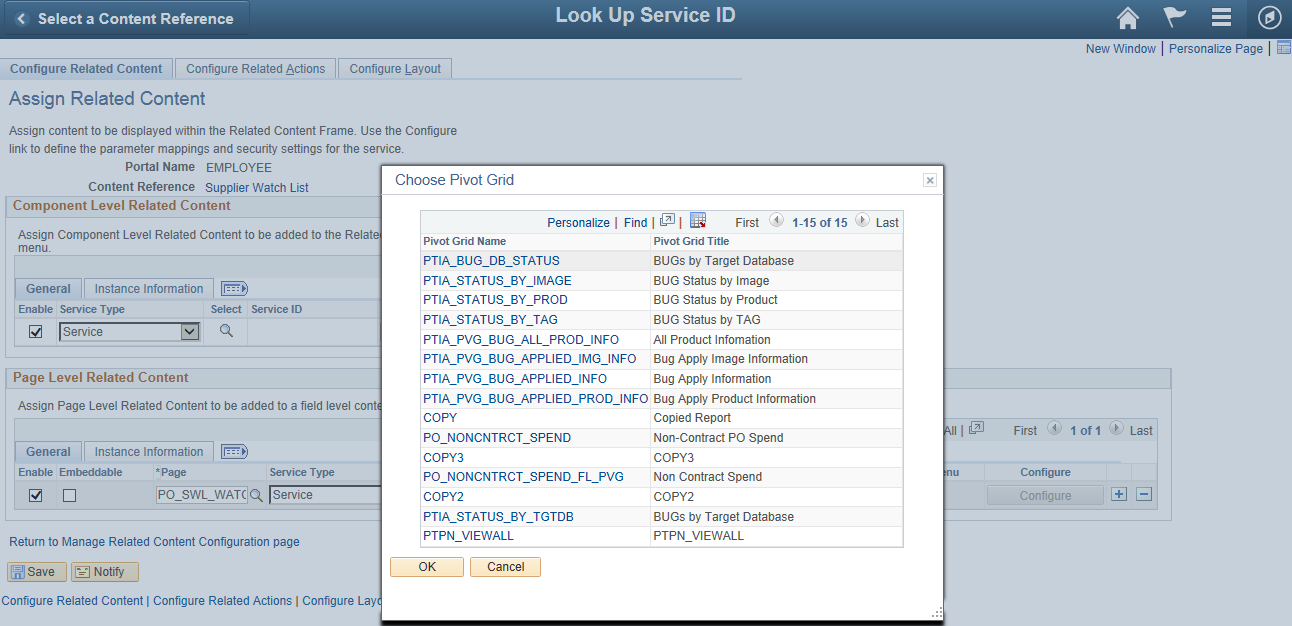
Note: The Pivot Grid model that you select at the Choose Pivot Grid page will be the source of the fields, prompts, criteria, query and settings for the analytic report template. This pivot grid template (or base template model) will be used to create new analytic reports for end users. The query used with the current Pivot Grid template will also be used for all analytic reports that will be created later using this template.
Every Pivot Grid model that is available in the database can be selected as a base template model.
Select a Pivot Grid model that will be used in the analytic report template.
In this example, select the PO_NONCNTRCT_SPEND model.
The Assign Related Content page reappears. In the Page Level Related Content section, the Page field is now set to PO_SWL_WATCH_FL and the Service ID field is set to ANALYTICSERVICE.
Note: An error message appears if no pivot grid model is selected in the Choose Pivot Grid page.
Click the Configure button in the Page Level Related Content section.
The Configure Service page appears displaying a list of available parameters (prompts).
Image: Configure Service page
This example illustrates the Configure Service page appears listing available parameters (prompts).
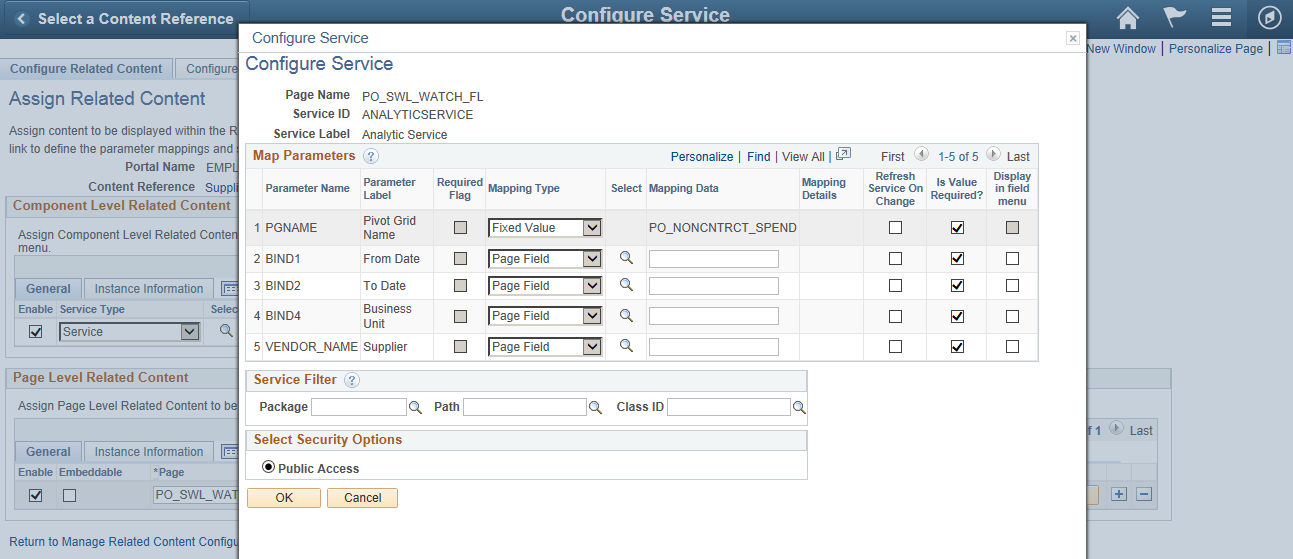
Use the Mapping Type column to set the parameters as Page Field or Fixed Value.
Note: If the parameter is set as a fixed value, the fixed value will override the default value in Pivot Grid Wizard. If the parameter has the mapping type set to Page Field, the value of the mapped field from the page will be passed dynamically from the page to the analytic report when creating or viewing the analytic report
Mapping is optional. If the mapping option is not set, then the default values (Page Field for Mapping Type and Empty for Mapping Data) ensures the prompt is not mapped; in this case, the default values in the Pivot Grid Wizard for the template model are applied while creating or viewing the analytic report.
Click the Select icon next to the Supplier parameter to display the Page Fields List page.
Image: Page Fields List page
This example illustrates the Page Fields List page listing all available fields on the Pivot Grid model.
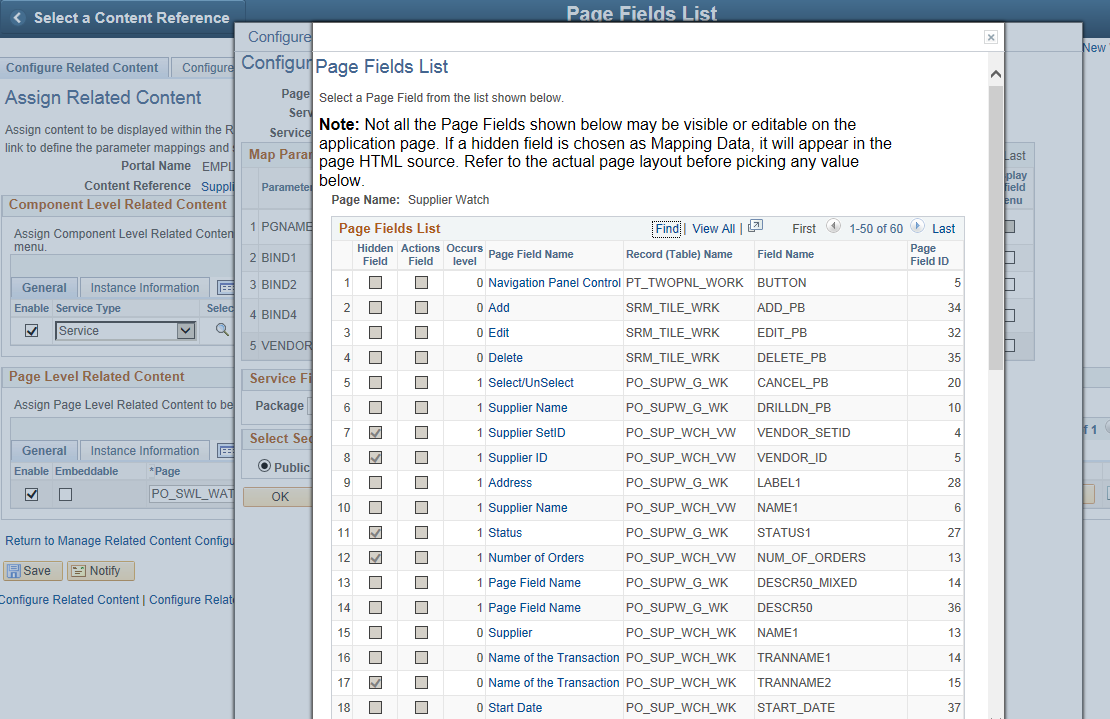
Click the level-0 Supplier link in the Page Field Name column and return to the Configure Service page.
Note: Simplified Analytic feature uses only level-0 fields for the mapping because Simplified Analytics is common to the entire page (in the right panel), so Simplified Analytics cannot be mapped to any specific row at level-1 and higher. A run-time error message appears if a field higher than level 0 is mapped.
Image: Configure Service page
This example illustrates the Configure Service page. The VENDOR_NAME parameter from the prompt is mapped to the page field Supplier, which is a hidden field.
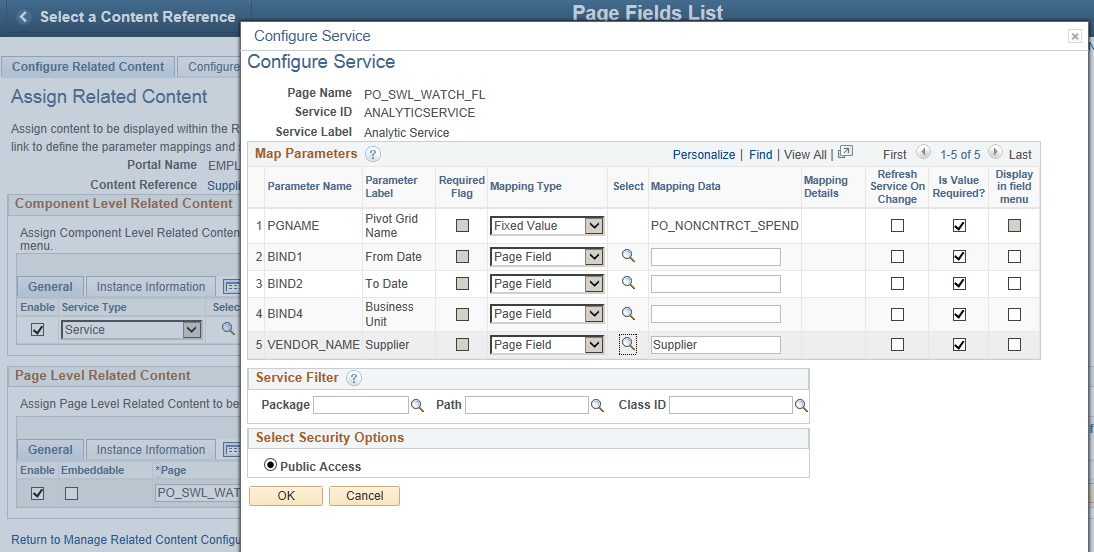
Optionally, select the mapping type and mapping data for the other parameters.
In this example, you will accept the default settings for all other parameters.
Click the OK button to return to the Assigned Related Content page.
Save your configurations.
Image: Assign Related Content page
This example illustrates the Assign Related Content page displaying the Page Level Related Content section with the Page field set to PO_SWL_WATCH_FL and the Service ID field set to ANALYTICSERVICE.
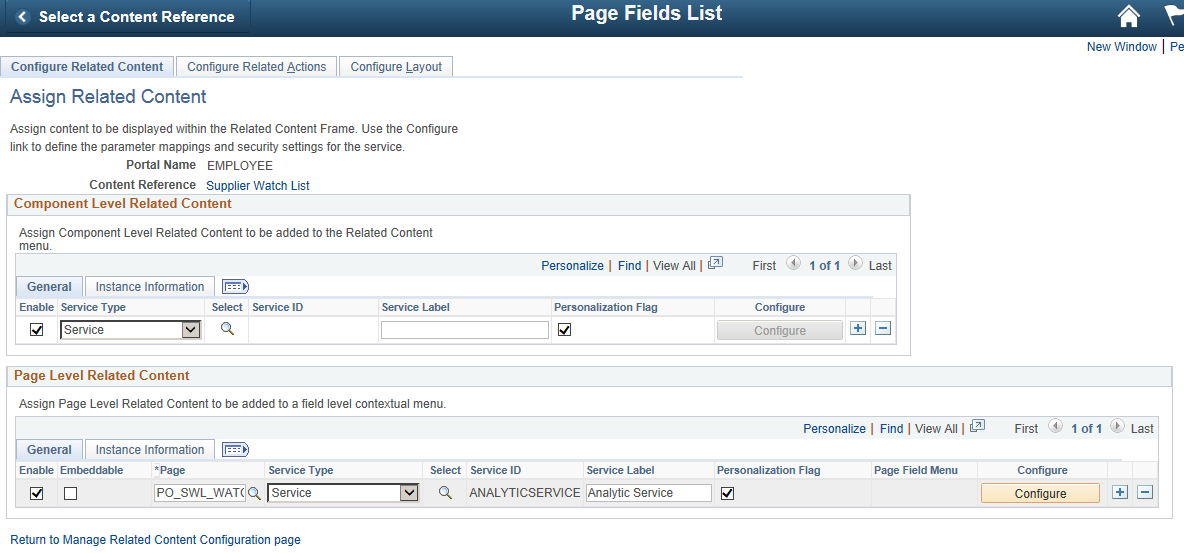
Preview the analytic report template by:
Returning to the Supplier Watch List by clicking the Supplier Watch List link on the Assign Related Content page.
Alternatively, select the Supplier Watch List from the Procurement Operations landing page.
Image: Supplier Watch list page displaying the My Analytics section
This example illustrates the Supplier Watch List page displaying the My Analytics section on the right. Because you have just associated a pivot grid template without creating any analytic report yet, the system displays the No analytics available message.
Clicking the Add (+) button in the My Analytics section to create a new analytic report.
The Create Analytics Wizard - step 1 appears.
Image: Create Analytics Wizard - step 1
Because the Supplier Watch List component is associated to only one analytic report template, PO_NONCNTRCT_SPEND, the What kind of analytic would you like to create drop-down list does not appear in the Create Analytics Wizard - step 1.
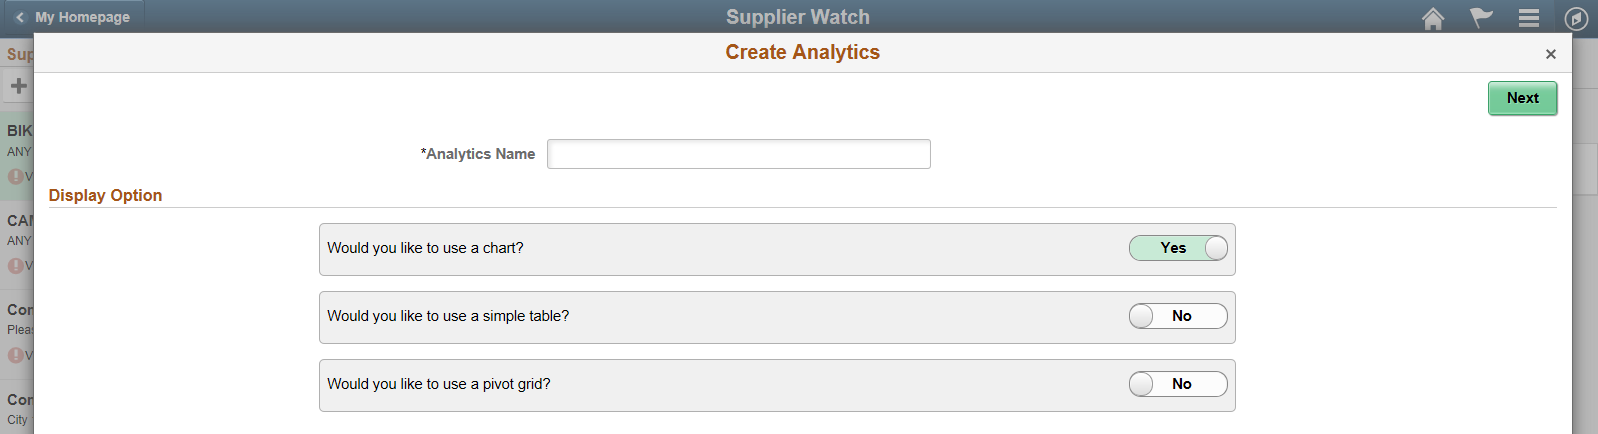
Note: You can associate more than one analytic report template (Pivot Grid template model) to a page in a component. For example, in addition to the PO_NONCNTRCT_SPEND model that you just configured in the previous steps, you can configure to associate an additional analytic report template, PROCUREMENT_CNTRCT_SPEND, to the same PO_SWL_WATCH_FL page in the Supplier Watch List component. Both PO_NONCNTRCT_SPEND and PROCUREMENT_CNTRCT_SPEND report template models will be available to users for creating their new analysis reports.
Optionally, use these steps to assign additional analytic report templates to the current component:
Clicking the Close icon at the top-right of the Create Analytics Wizard to close the wizard.
Returning to the Assign Related Content page for the current component by selecting PeopleTools, Portal, Related Content Service, Manage Related Content Service, Assign Related Content to an Application, <fluid component>, <fluid page>.
In this example, you return to the Procurement Operations > Supplier Watch List component.
Clicking the Add (+) button in the Page Level Related Content section.
Repeating steps 5 through 15.
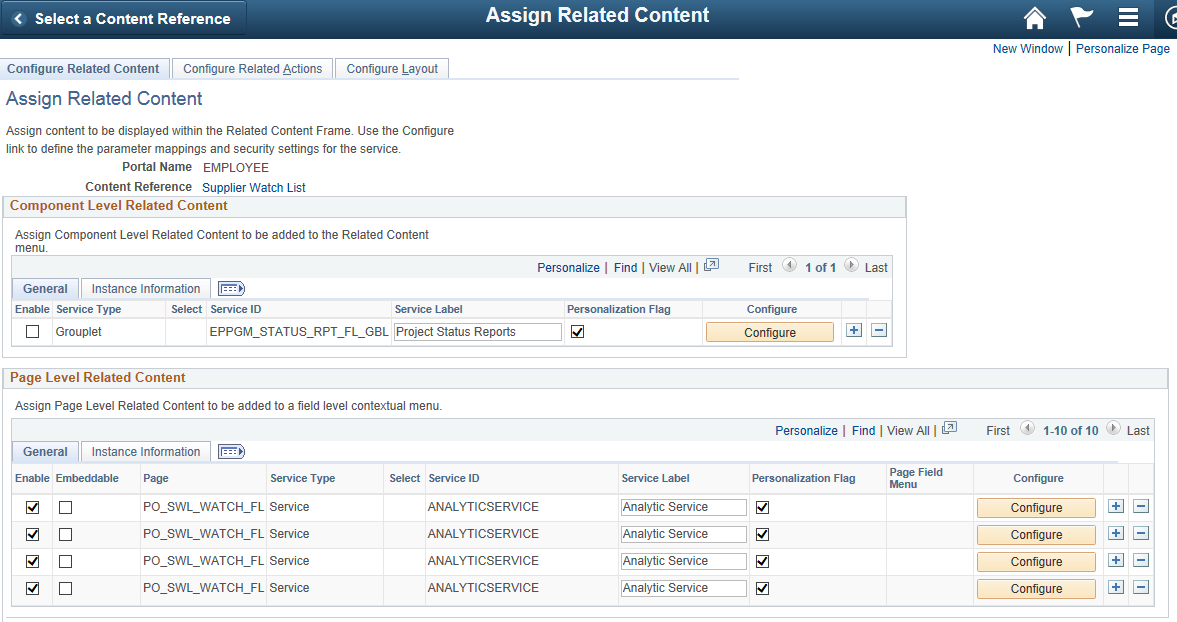
Image: Assigned Related Content page
This example illustrates the Assigned Related Content page showing four analytic report templates attached to the same PO_SWL_WATCH_FL page in the Supplier Watch List component.
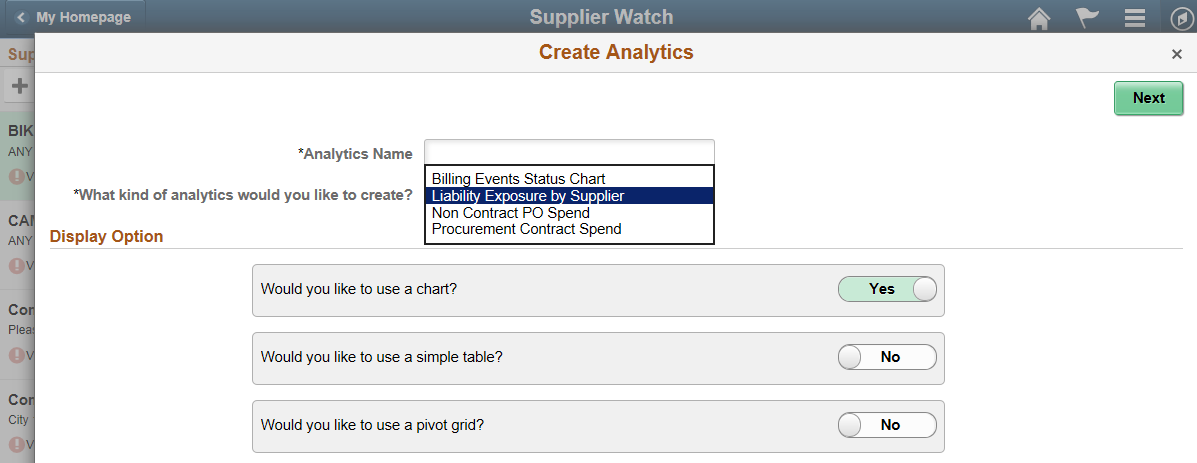
Preview the analytic report templates using step 16.
The Create Analytics Wizard - step 1 now displays the What kind of analytic would you like to create drop-down list listing four analytic report templates. Note that these analytic report templates are listed because they use the queries to which you have access permission, and these templates were associated to the Supplier Watch List component.
Image: Create Analytics Wizard - step 1
This example illustrates the Create Analytics - step 1. The What kind of analytic would you like to create drop-down list appears showing four options from the list.
As a user of Supplier Watch List, complete the following steps to create the analytic report:
Access the component for which you have the Simplified Analytics feature enabled.
In this example, access the Supplier Watch List component under Procurement Operations.
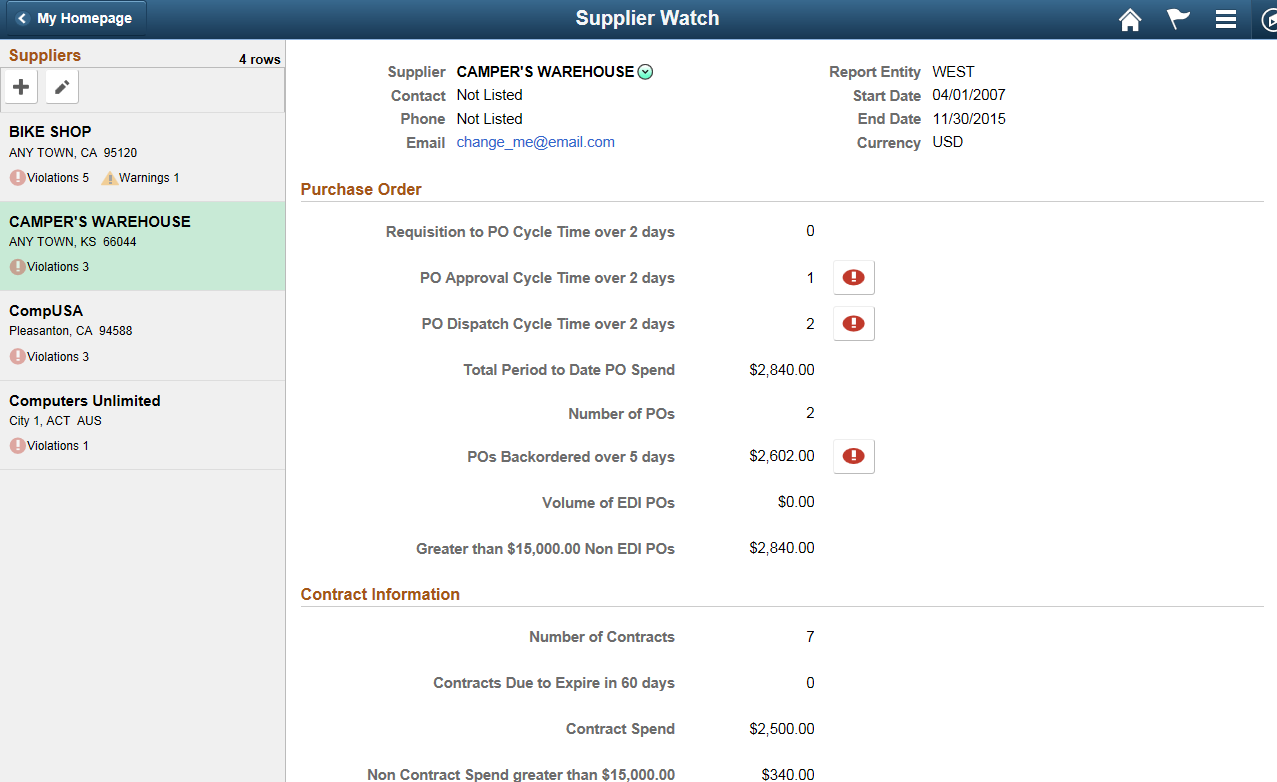
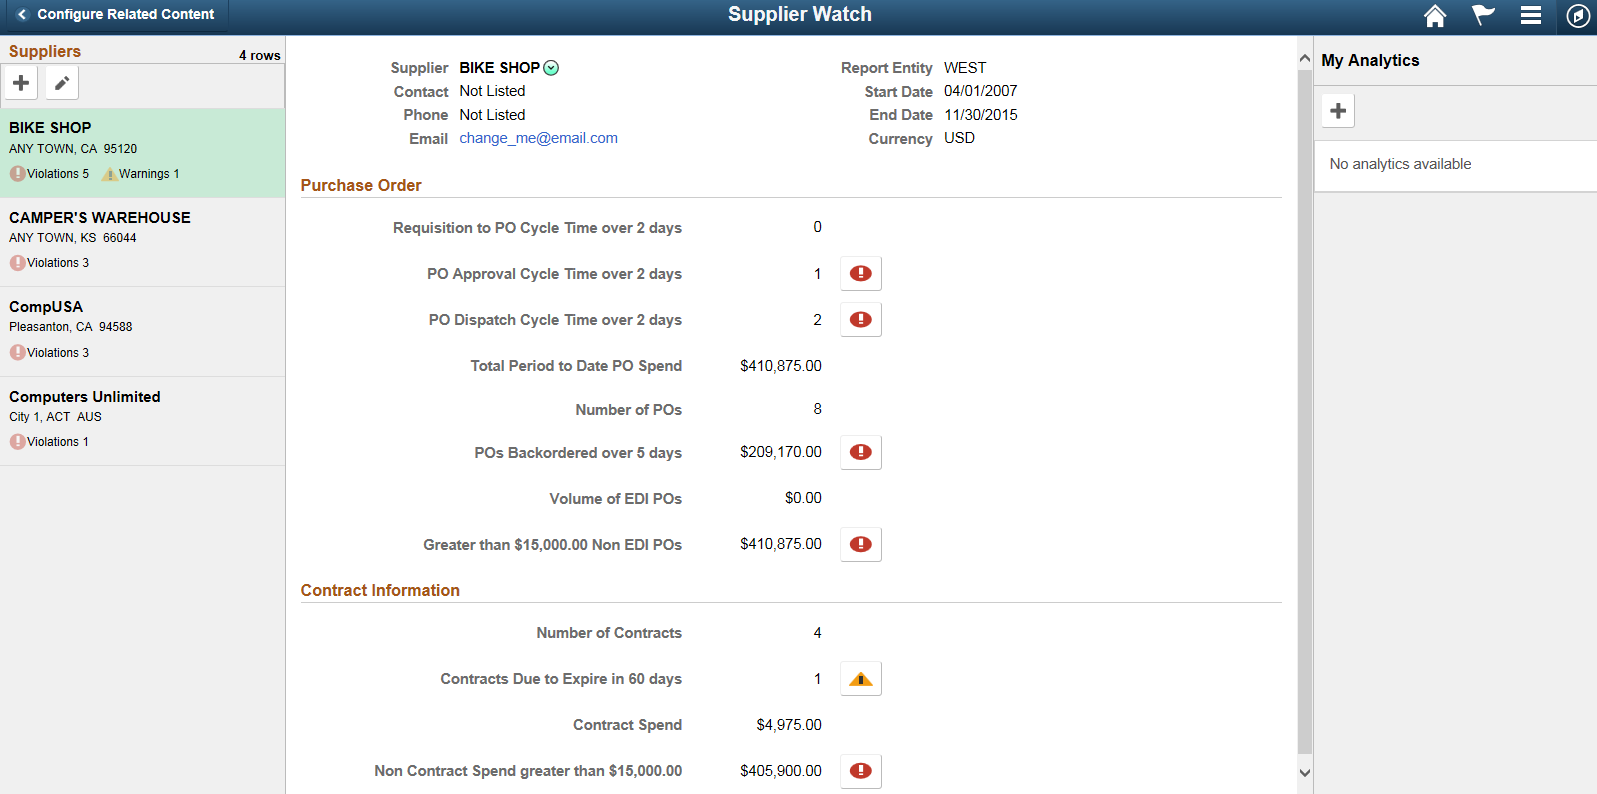
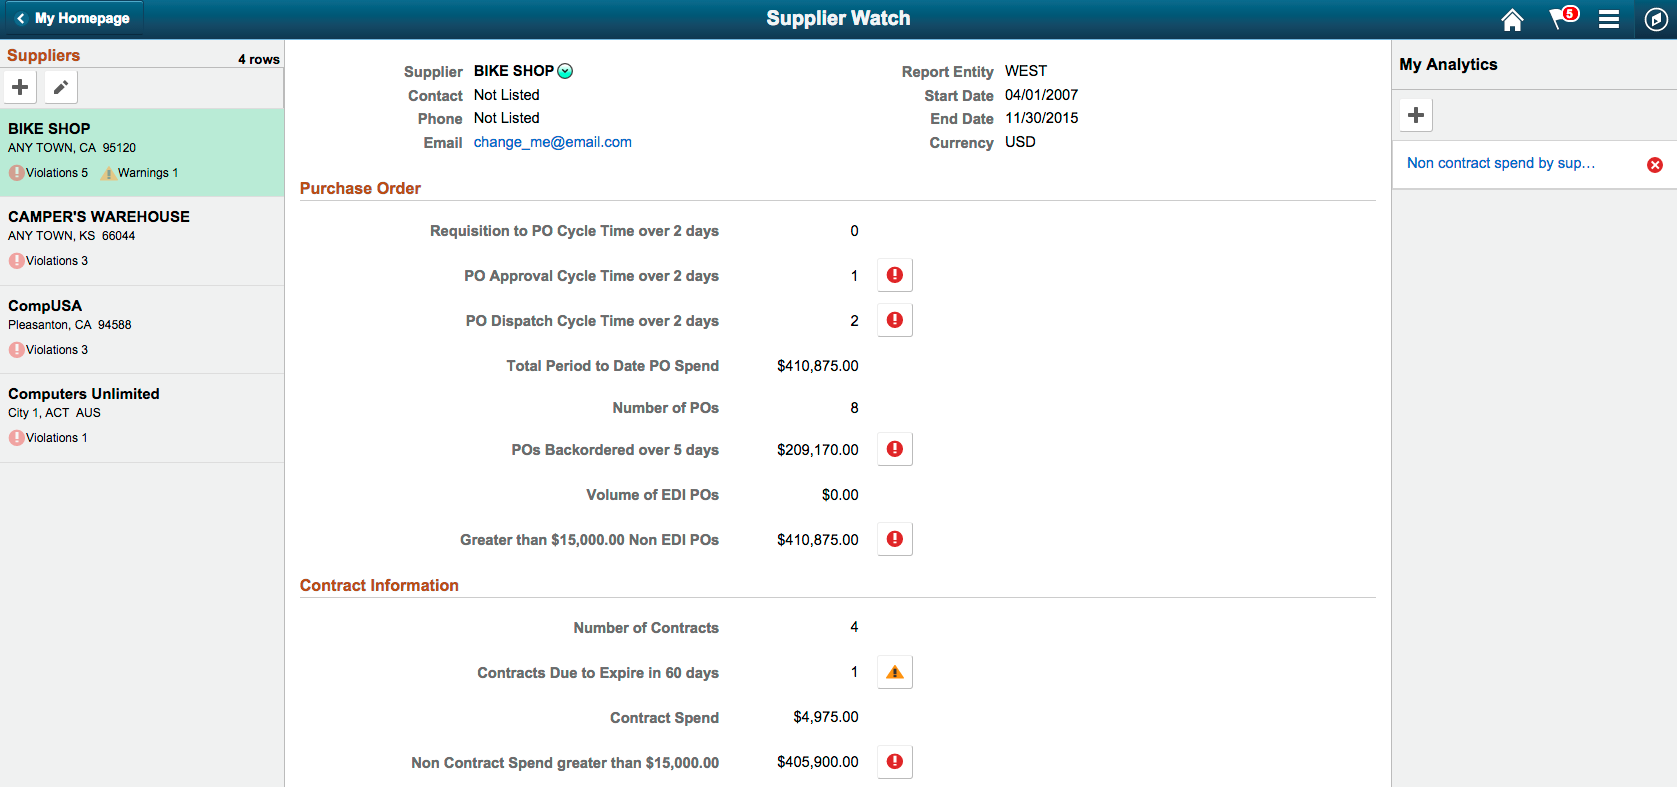
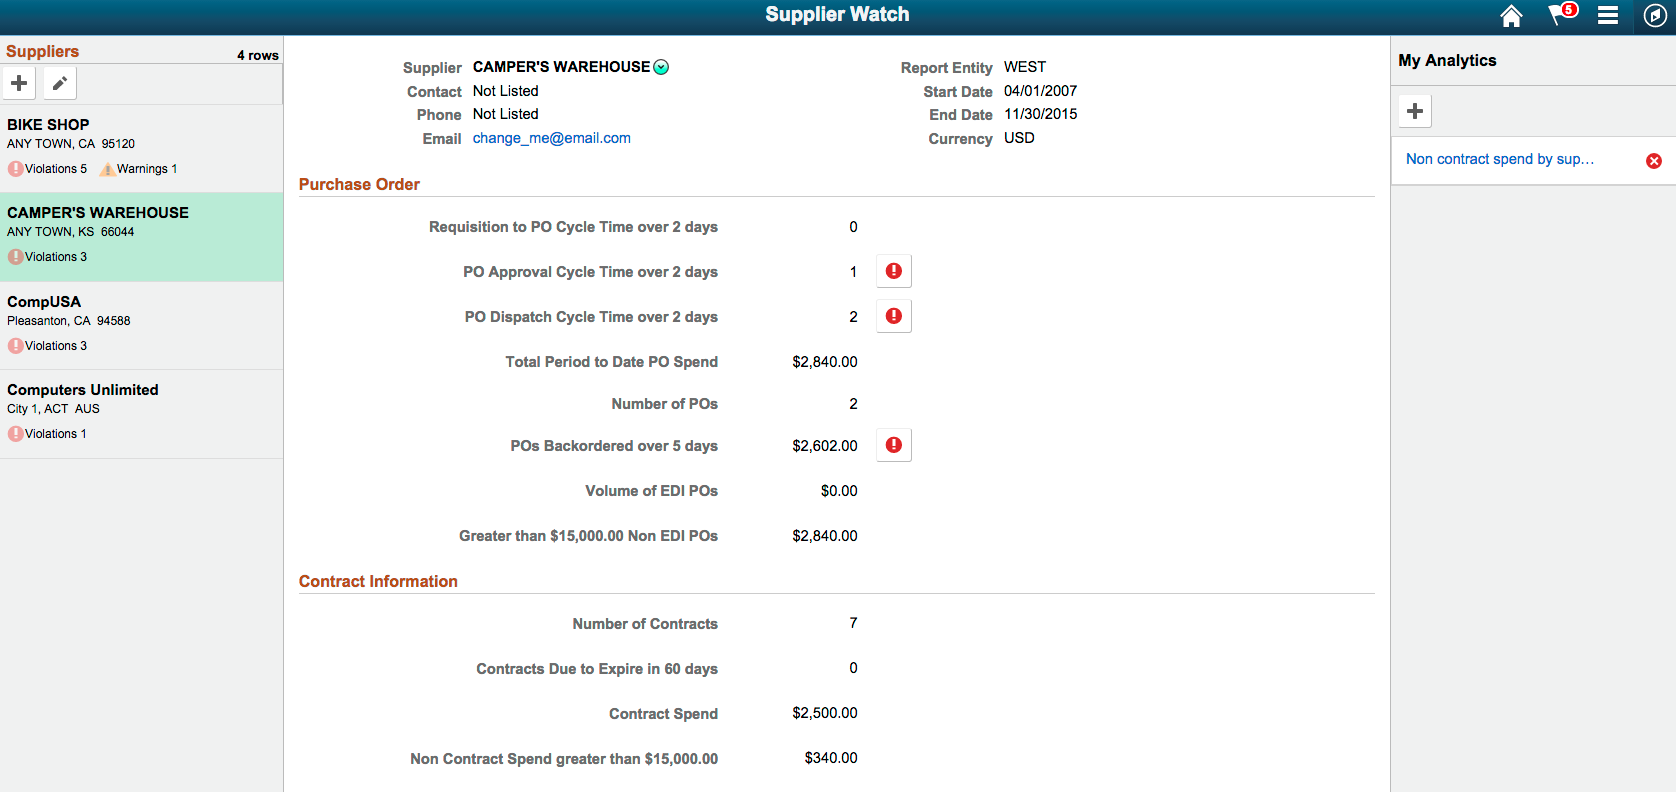
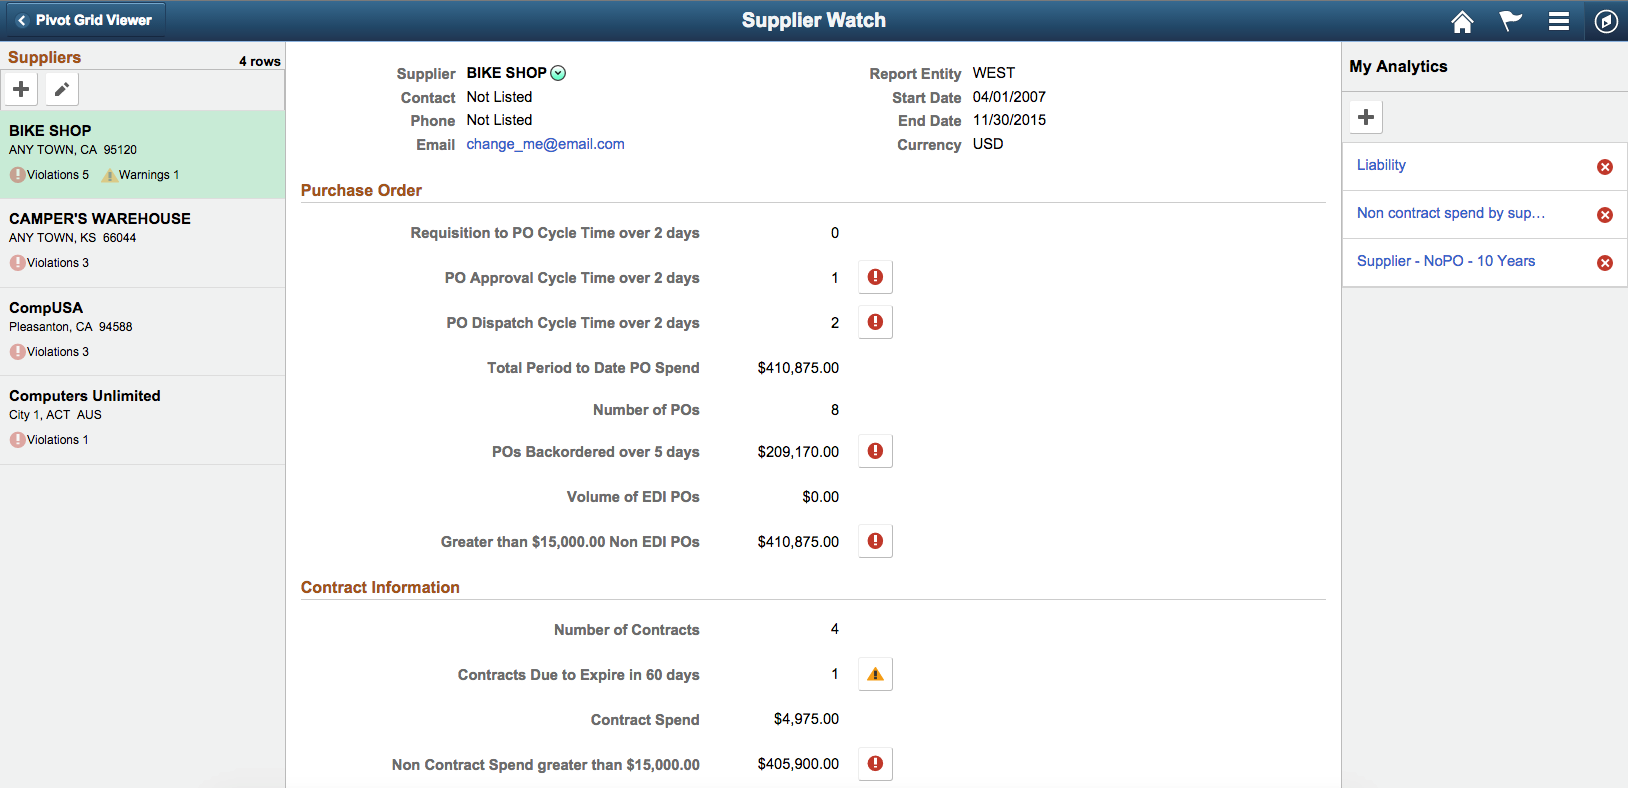
Image: Supplier Watch page
This example illustrates the Supplier Watch page displaying the details of supplier, purchase order, and contract information for supplier BIKE SHOP.
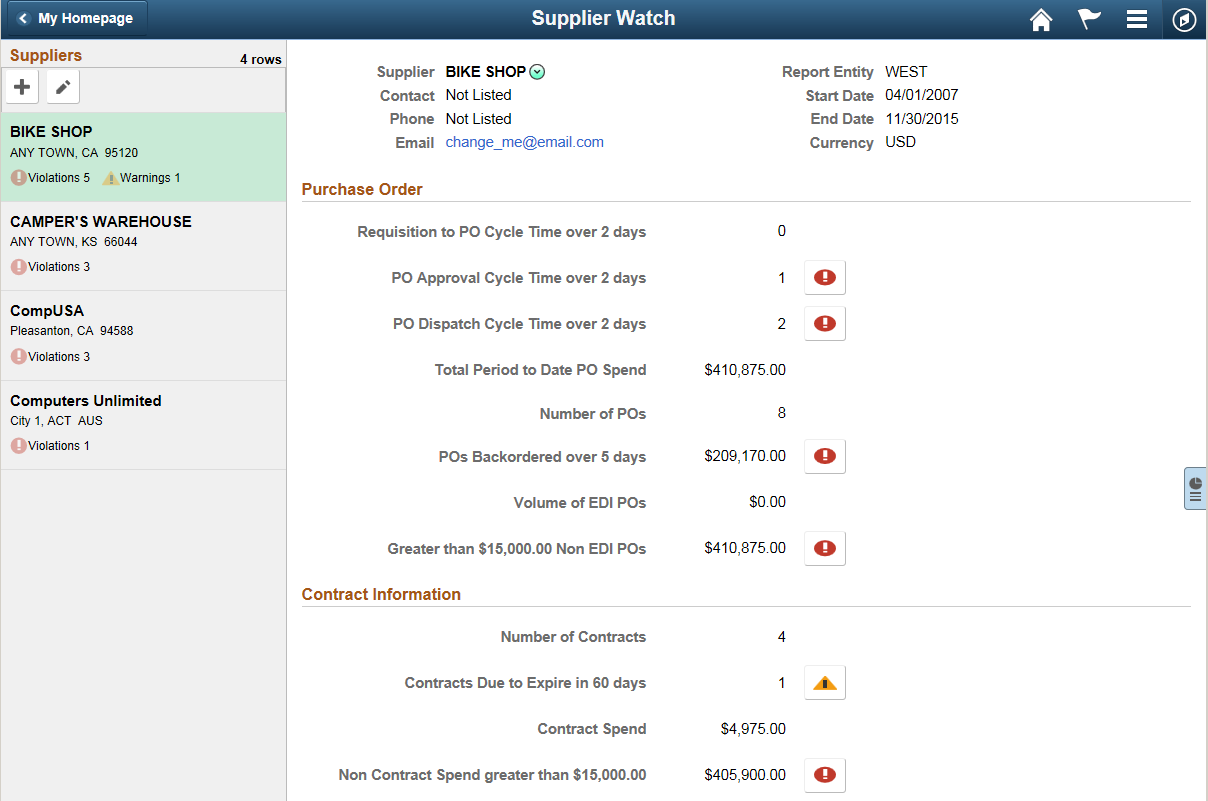
Optionally, view the information for other suppliers by clicking their names under the Supplier list on the left of the view.
Click the Expand icon at the right of the view to expand the My Analytics section.
Image: Supplier Watch page displaying the My Analytics section
This example illustrates the Supplier Watch page displaying the My Analytics section on the right of the view. Because you have just created the analytic report templates without creating any analytic report yet, the No analytics available message is displayed.

Note: When both component-level related information and Simplified Analytics are configured for a component, the right panel of the window has two tabs: Related Information and My Analytics. When no templates are available for the current user, the system does not display the My Analytics section/tab.
Click the Add (+) button under the My Analytics section to create a new analytic report.
A modal window appears displaying the first step of the Create Analytics Wizard.
Enter the name of the analytic report into the Analytics Name field.
In this example, enter Non contract spend by supplier.
Select an analytic report template from the What kind of analytics would you like to create drop-down list.
In this example, select the Non Contract PO Spend option from the list.
Image: Create Analytics Wizard - step 1
This example illustrates the Create Analytics Wizard - step 1. The analytic report Non contract spend by supplier will use the analytic template Non Contract PO Spend.
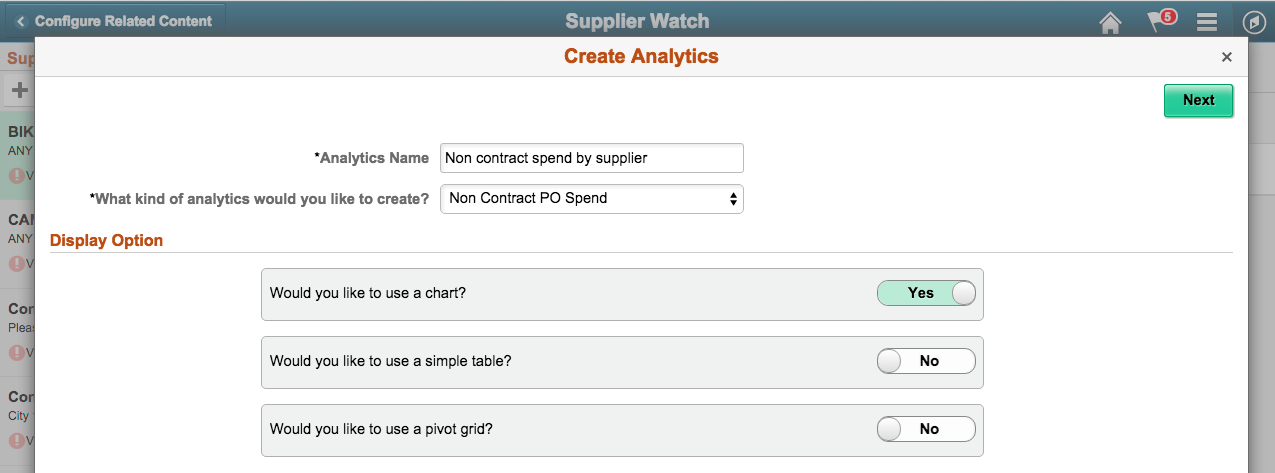
Use the Display Option section to set the chart, table, and grid for the analytic report.
You can use any combination of the display options. In this example, accept the default settings with the chart option set to Yes, and the table and the grid options set to No.
Click the Next button to display the Create Analytics Wizard - step 2.
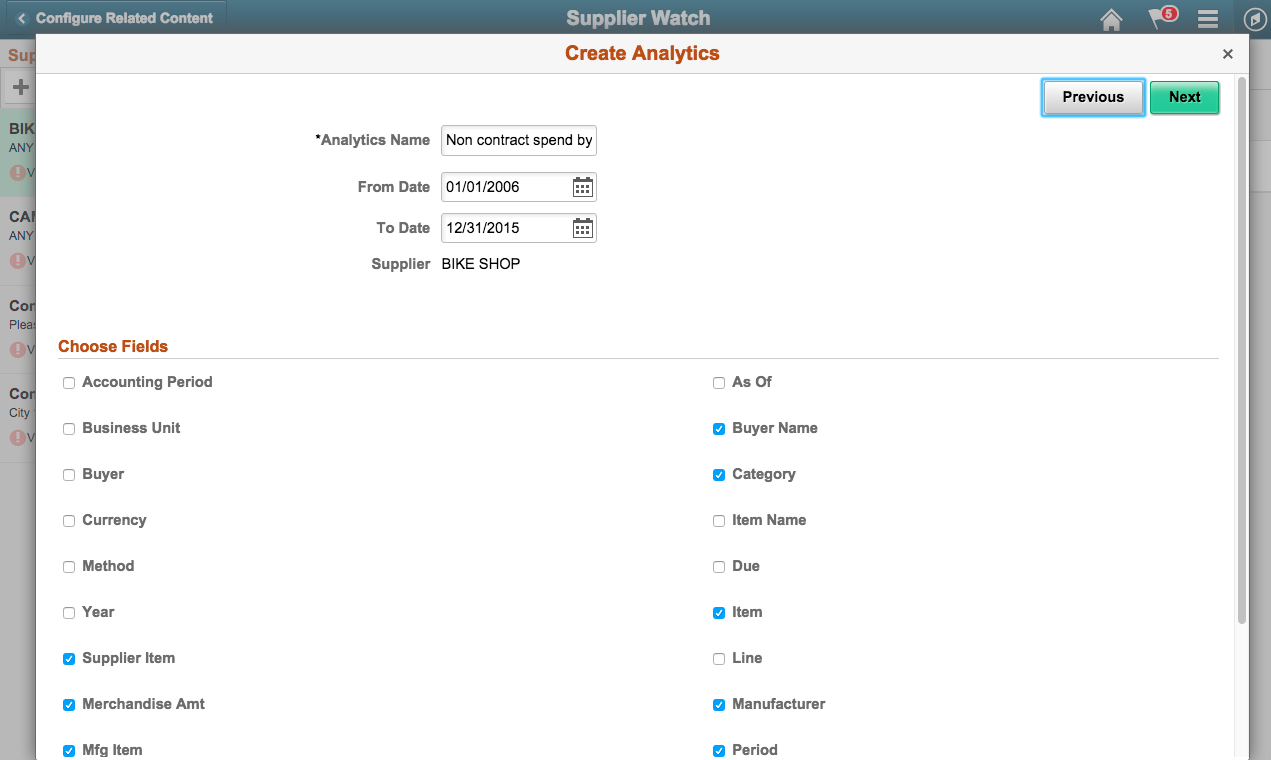
Set the dates within the last 10 years, from 01/01/2006 to 12/31/2015.
Use the Choose Fields section to select the fields that will be available in the analytic report.
Note: Only the fields and prompts that are set to Visible in the base template pivot grid model will appear. Some fields are preselected because those fields form a part of rows/columns/axis/filters in the base pivot grid model.
Image: Create Analytics Wizard - step 2
This example illustrates Create Analytics Wizard - step 2. The Supplier field is read-only because the value for this field is implicitly passed from the transaction page based on the mapping configuration in related content setup. The Supplier field is the prompt and supplier BIKE SHOP is the prompt value for the report.
Click the Next button to display the analytic report preview window, Create Analytics Wizard - step 3.
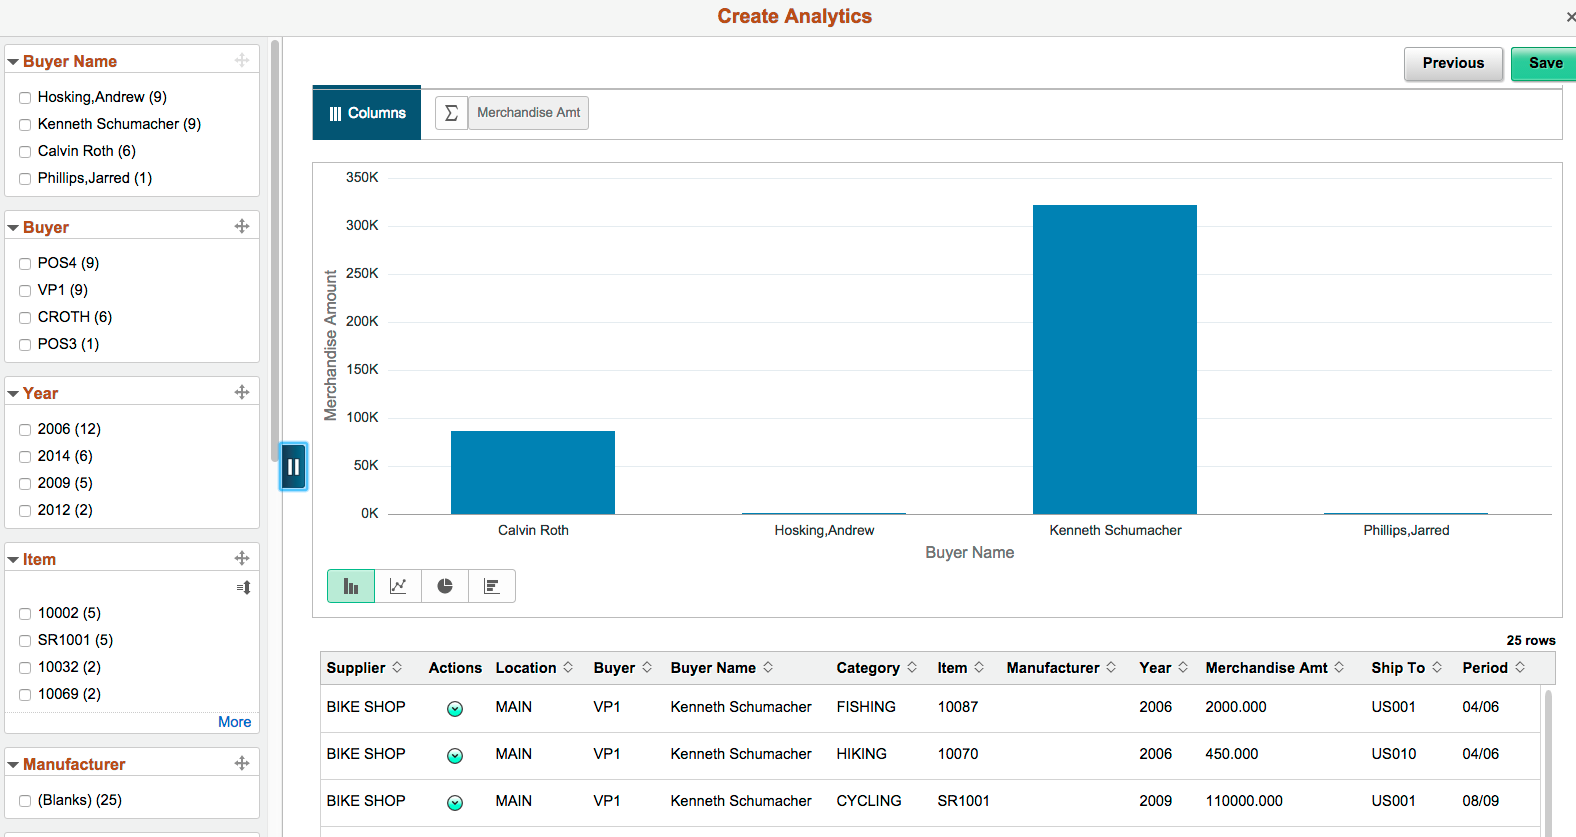
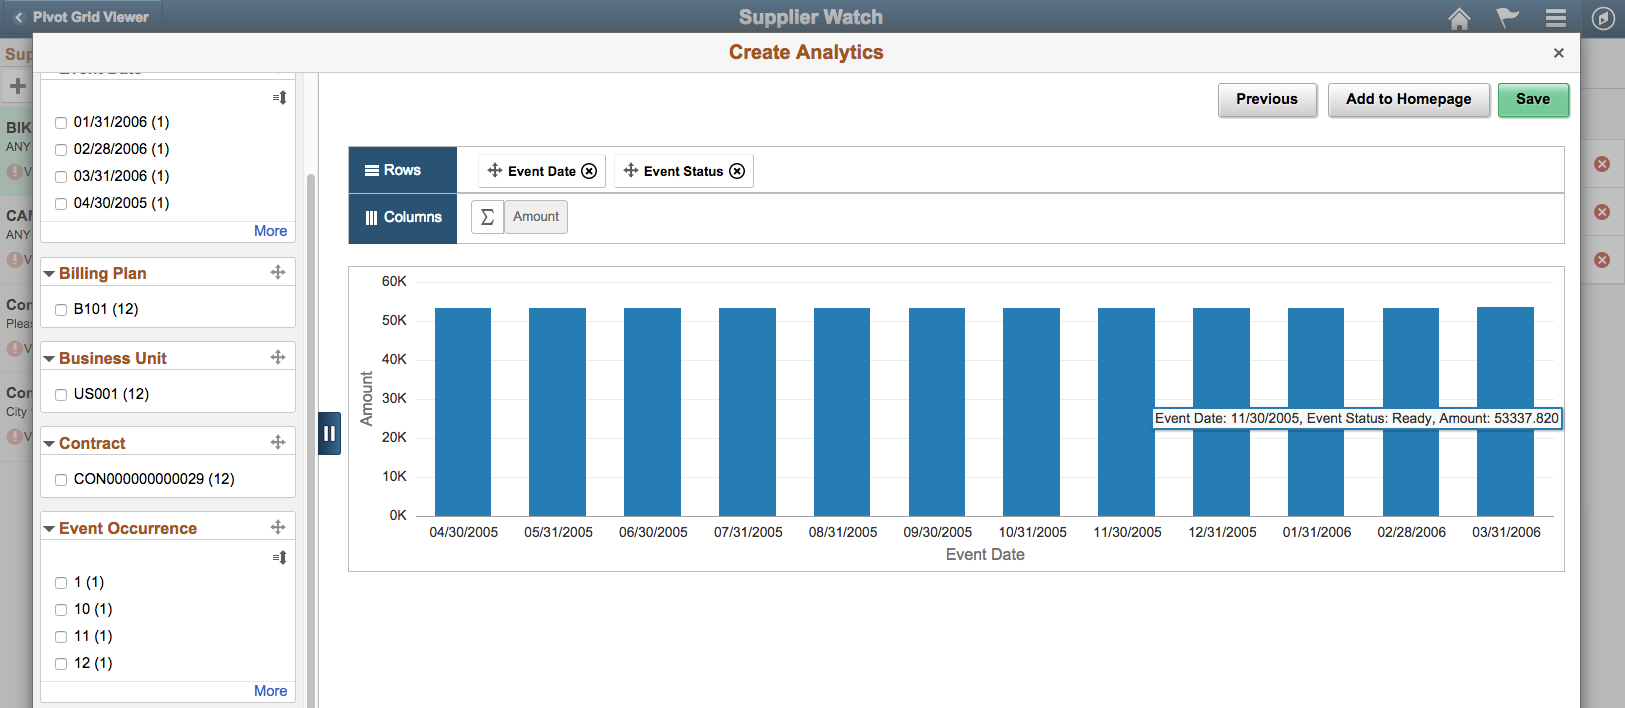
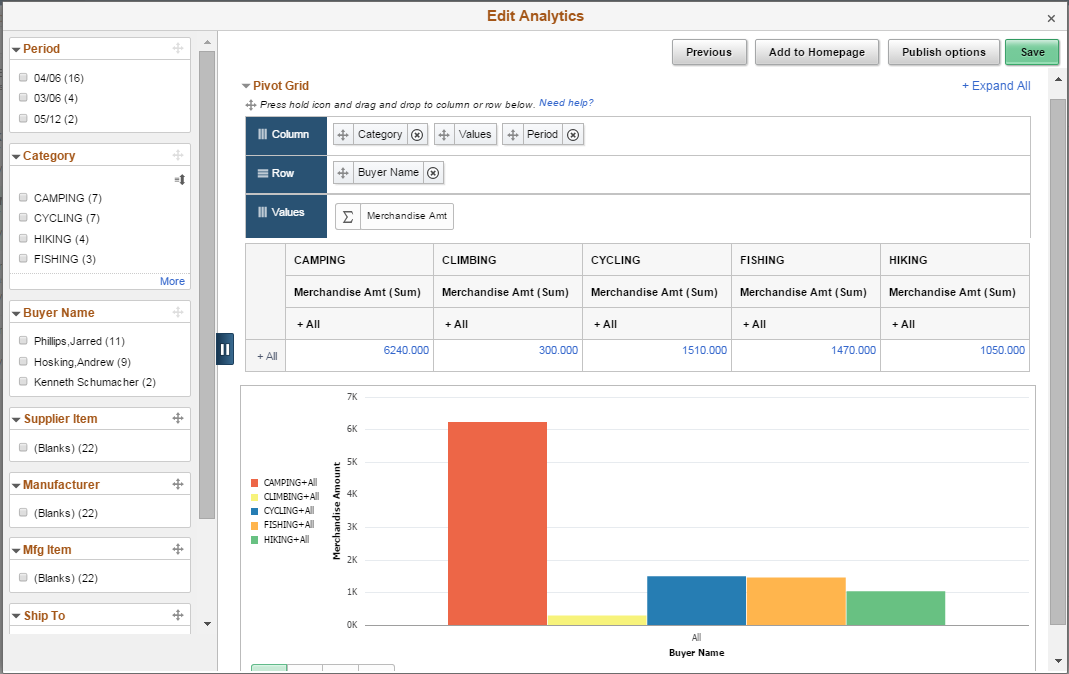
Image: Create Analytics Wizard - step 3 - preview window
This example shows the preview window of the analytic report Non contract spend by supplier. The chart displays the report for each buyer and their merchandise amount.
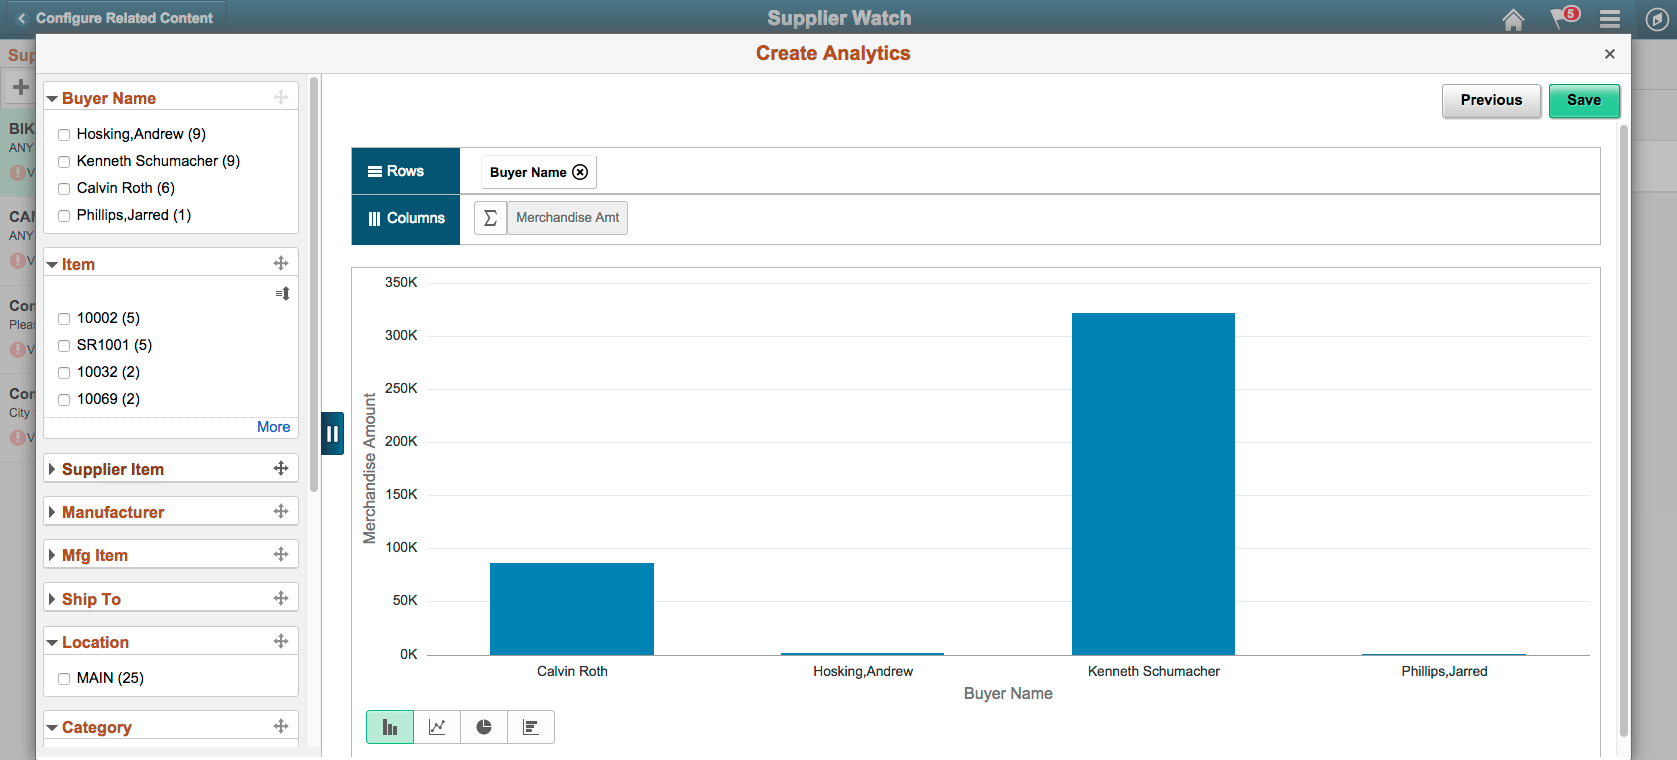
Optionally, change the chart view by dragging and dropping fields from the facet area to the Rows and Columns areas or by applying filters (facets) in the chart.
Image: Changing the chart view
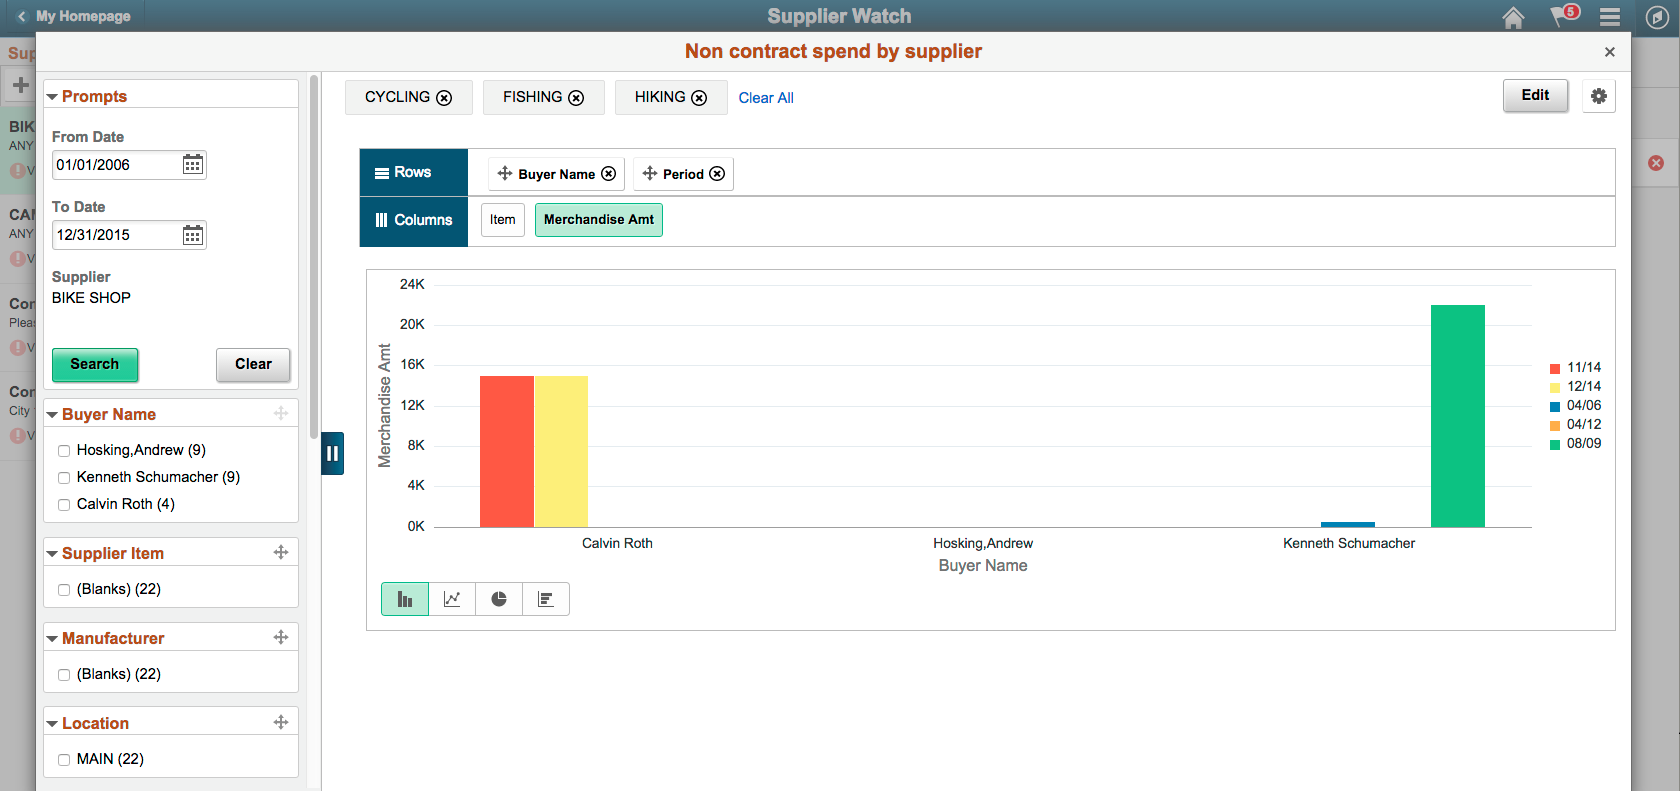
In this example, the Period field was dragged from the facet area and dropped at the Rows area. The Period facet is now a series for the chart. Filter values CYCLING, FISHING, and HIKING from the Category filter are also applied.
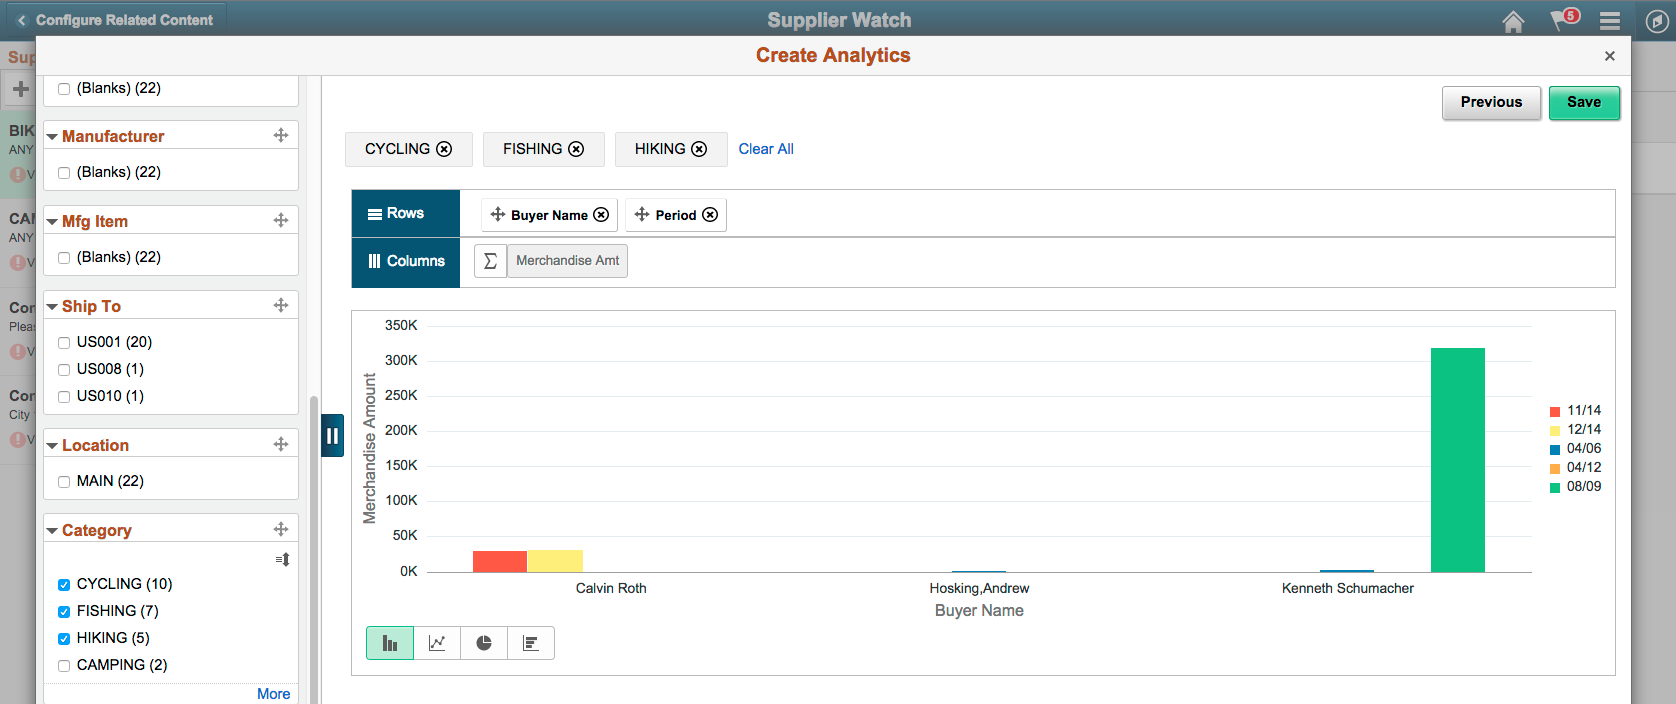
Image: Change dimension
In this example, dimension Item was dragged from the facet area to the Columns area. The Item dimension now is a fact, and the chart now plots the Count of Items.
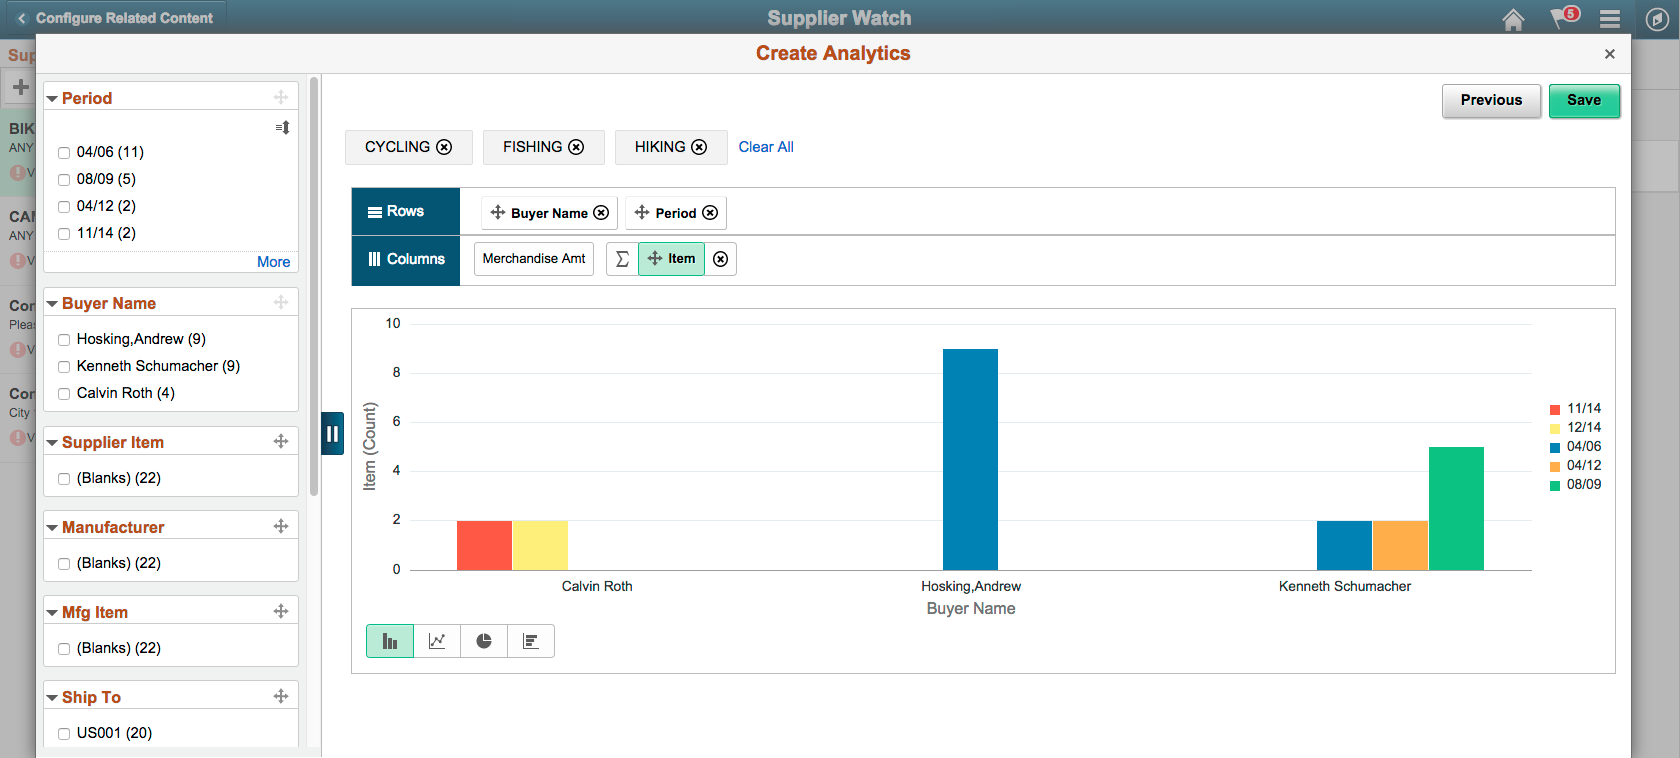
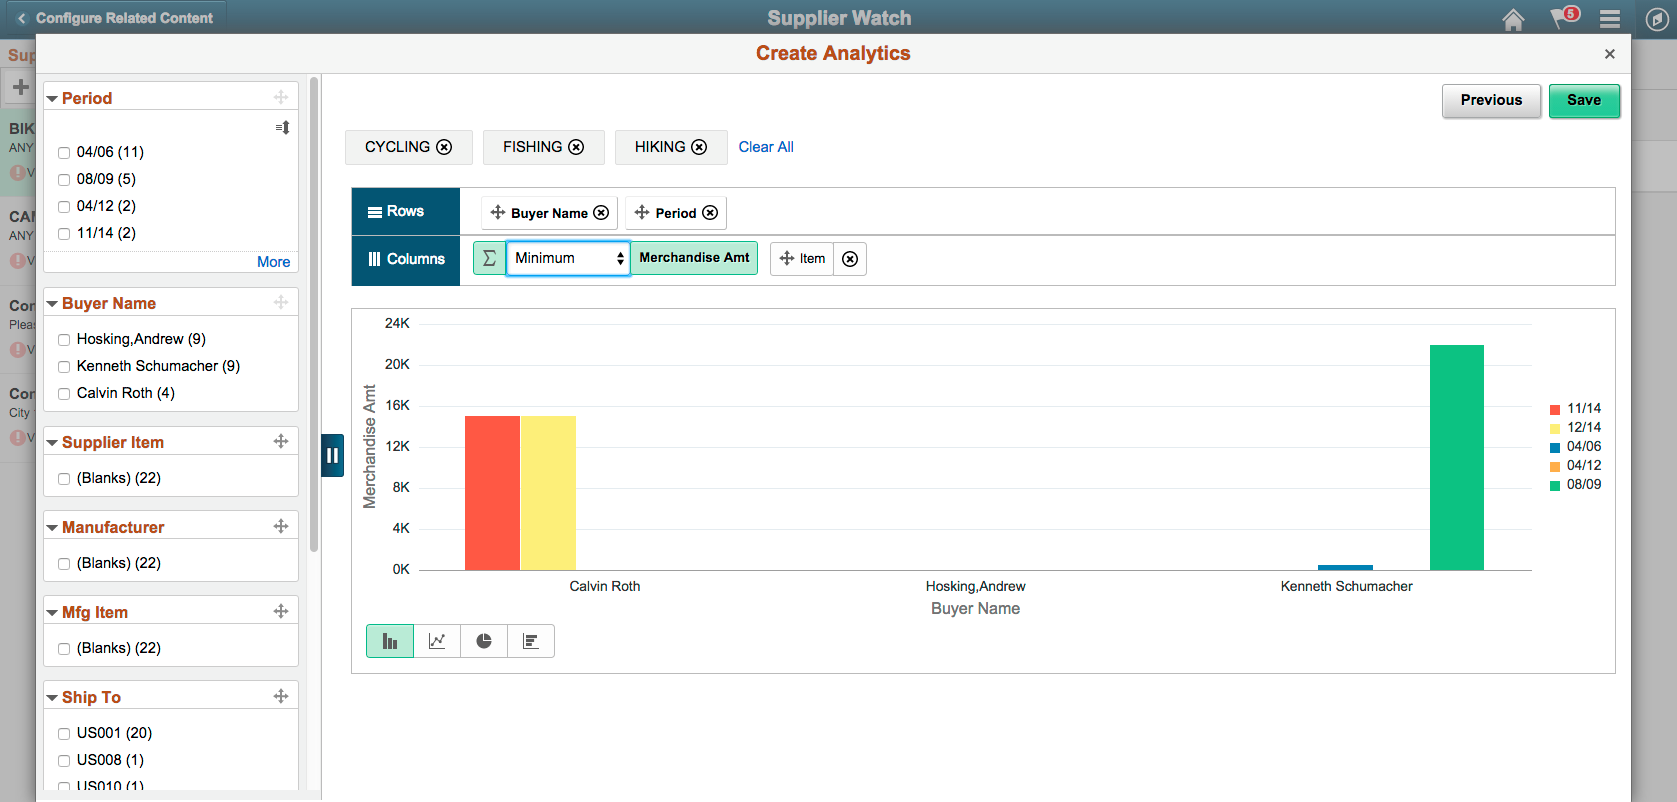
Image: Changing aggregate value
In this example, the value in the Aggregate drop-down list was changed from Sum to Minimum.
Save the analytic report. . After the report is saved, it appears under the My Analytics section on the right panel of the component.
On saving the analytics report, the Add to Homepage button appears for all the users. Pivot Grid administrator and the Pivot Grid super user can also see the Publish Options button in addition to the Add to Homepage button.
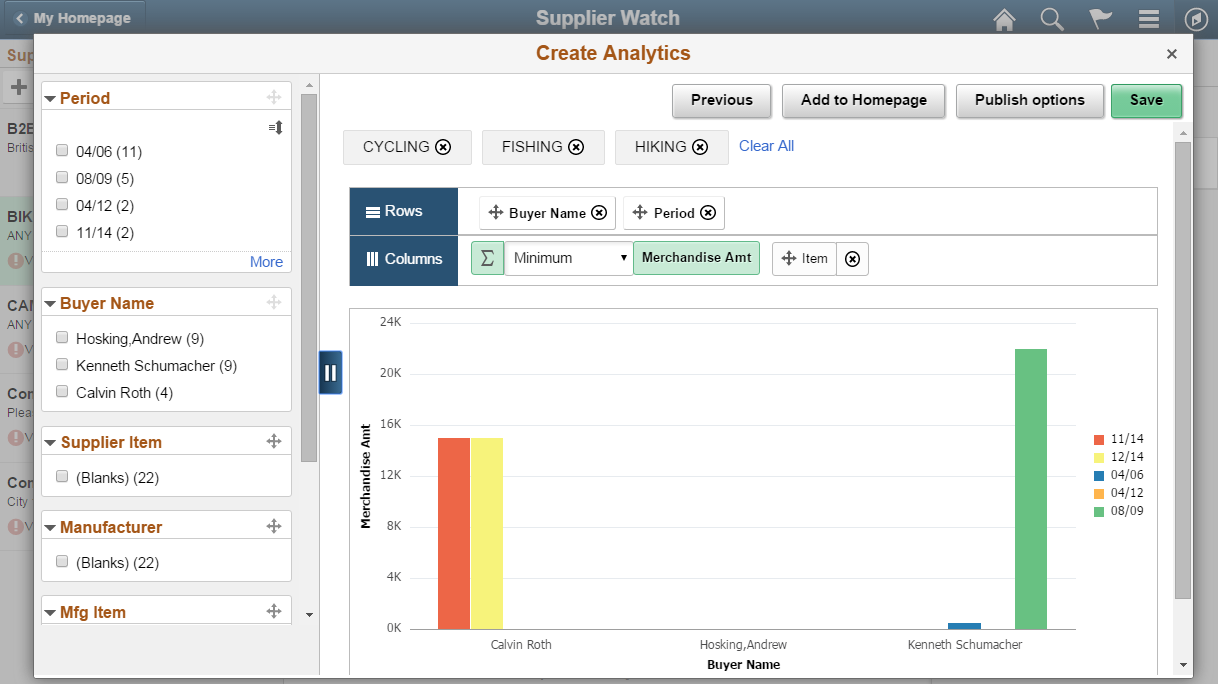
Image: Add to Homepage button and Publish Options button
This example shows the Add to Homepage button and the Publish Options button which appear on saving the analytic report.
Click the Close icon at the top-right of the window to return to the Supplier Watch list and to confirm the appearance of the newly created analytic report link in the My Analytics section.
Image: Supplier Watch displaying the analytic report link
This example shows the Supplier Watch displaying the analytic report link Non contract spend by supplier in the My Analytics section. Supplier BIKE SHOP is selected.
Click the report name link in the My Analytics section to open it in a modal window.
For the Pivot Grid administrators and the Pivot Grid super users also, the Add to Homepage link is available under the Options Menu.
Image: Supplier Watch displaying information for supplier BIKE SHOP
In this example, the analytic report Non contract spend by supplier displays the information for supplier BIKE SHOP between 01/01/2006 and 12/31/2015 using the same layouts that you already saved.
Optionally, view the non-contract purchase orders for the other suppliers:
Click the Close icon at the top-right of the window to return to the Supplier Watch list.
Click one of the other supplier names in the Supplier list on the left of the window.
In this example, click CAMPER’S WAREHOUSE.
Image: Supplier Watch displaying information for supplier CAMPER’S WAREHOUSE
This example shows the Supplier Watch displaying the analytic report link, Non contract spend by supplier, under the My Analytics section. Supplier CAMPER’S WAREHOUSE is selected.
Click the Non contract spend by supplier link in the My Analytics section.
The analytic report displays the information for the selected supplier.
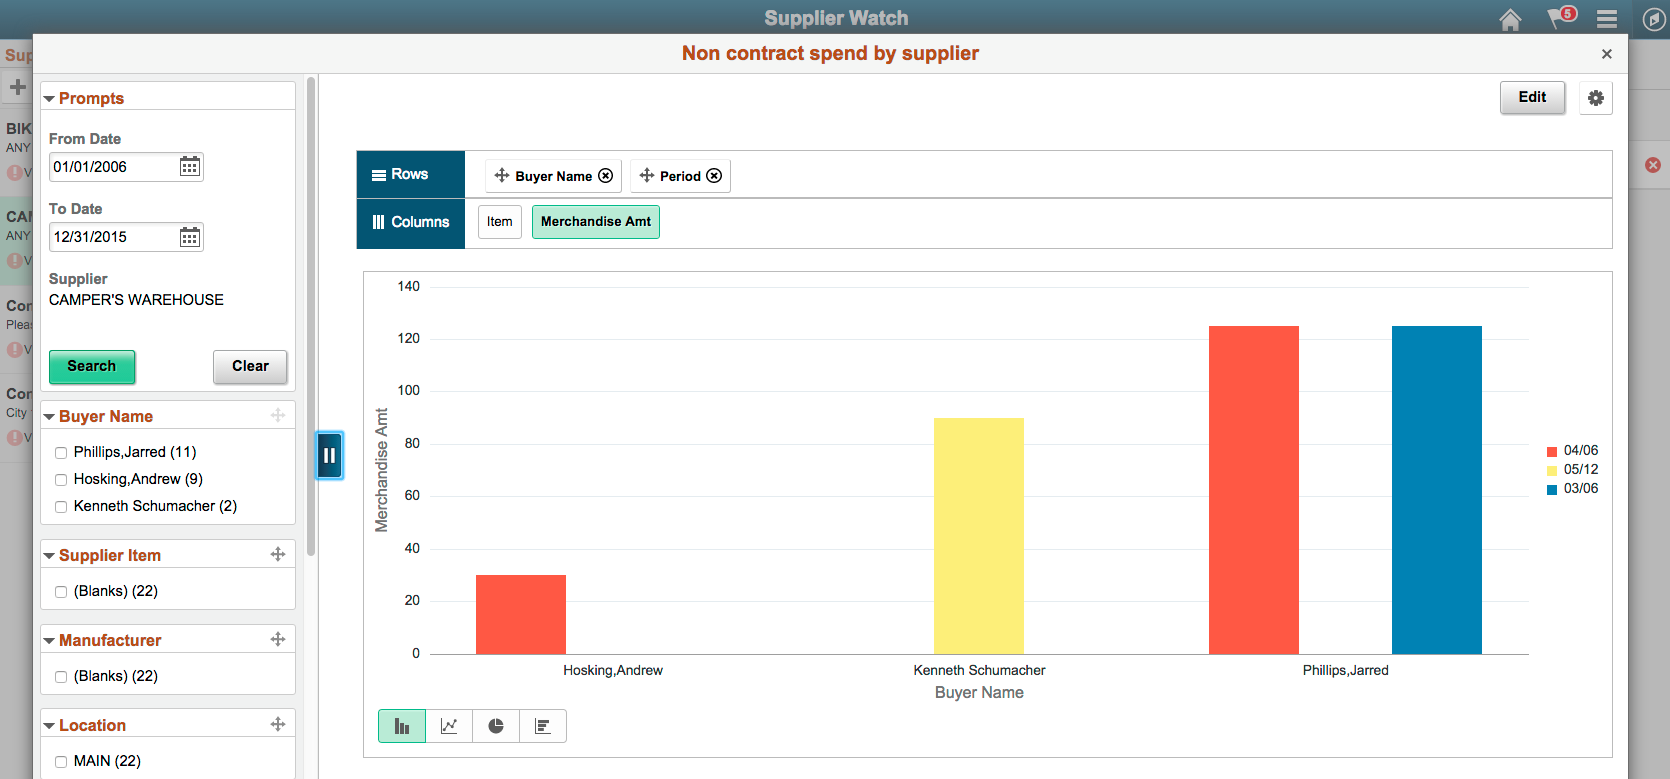
Image: Analytic report for the supplier CAMPER’S WAREHOUSE
In this example, the analytic report displays the information for supplier CAMPER’S WAREHOUSE between 01/01/2006 and 12/31/2015 using the same layout that you already saved.
To add an analytic report to the fluid homepage:
While viewing the report, all users can select the Add to Homepage option under Options menu to access the Add to Homepage window.
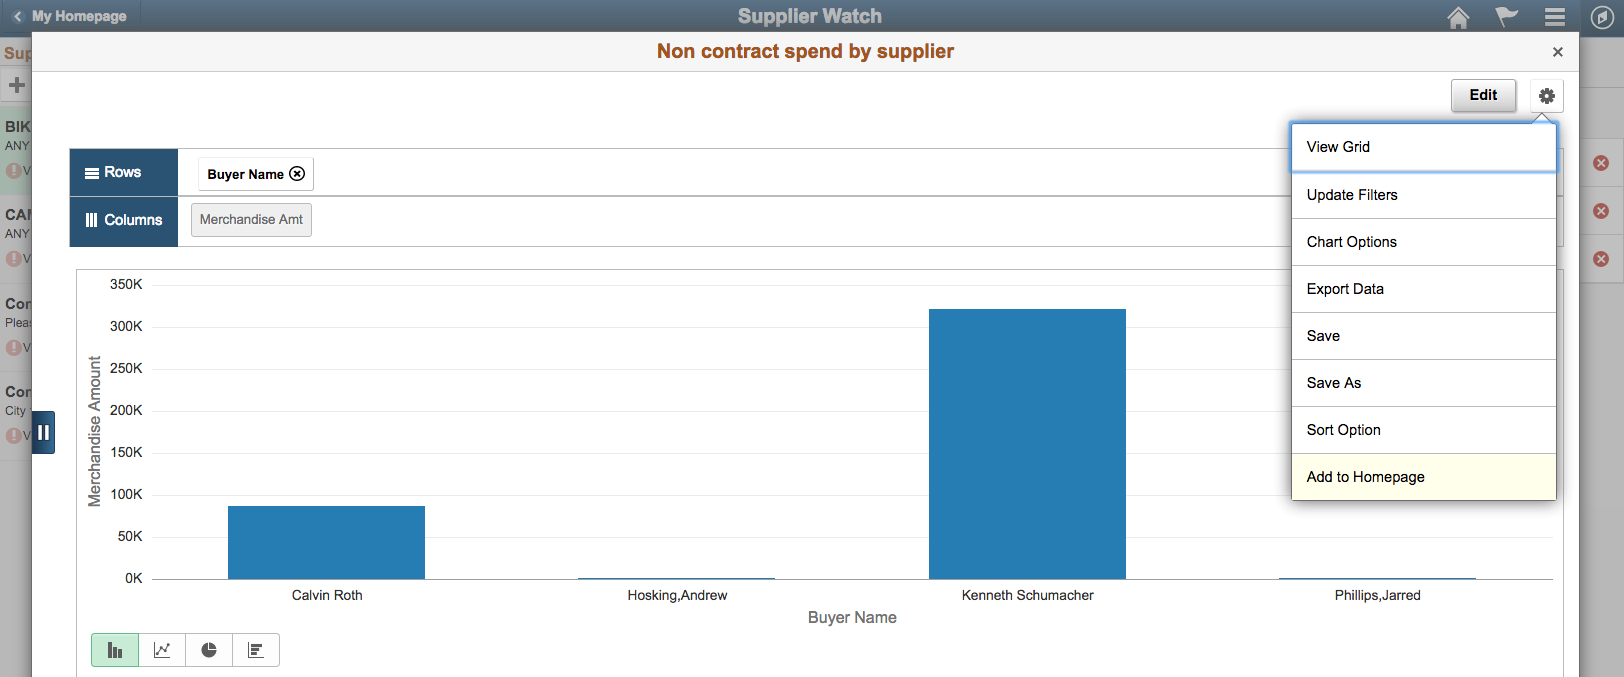
Image: Options menu
This example illustrates the Add to Homepage and other options under Options menu.
If you are not an administrator or a super user, you can also access the Add to Homepage window while creating or editing the report using the Add to Homepage button in the Create Analytics Wizard - step 3 after you save the report or in the Edit Analytics Wizard - step 3.
Image: Create Analytics Wizard - Add to Homepage button
This example illustrates the Create Analytics Wizard – step 3. The Add to Homepage button is at the top-right of the window.
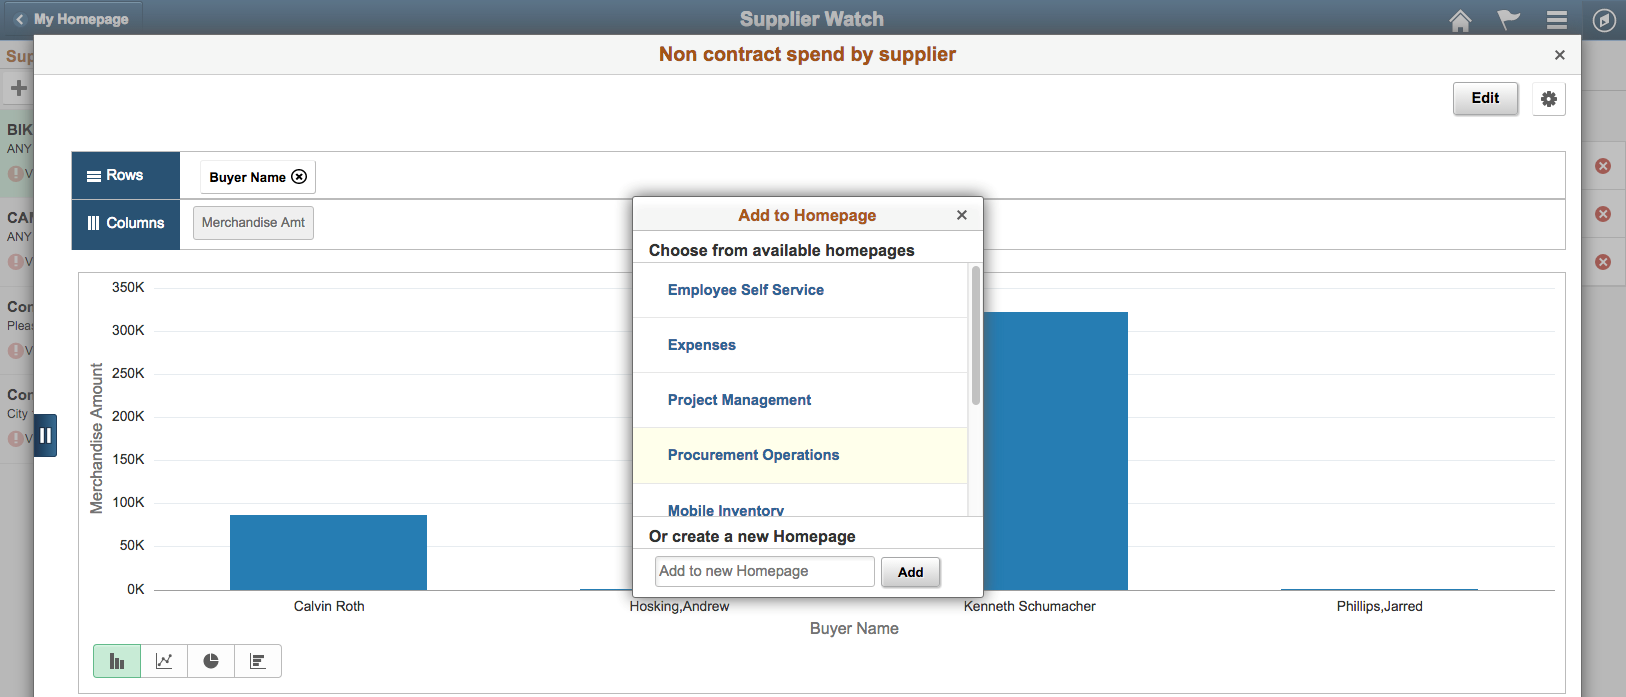
In the Add to Homepage window, select a homepage from the list of available homepages.
Image: Add to Homepage window
This example illustrates the Add to Homepage window listing all available homepages.
Click the OK button to confirm that the analytic report was added to the homepage.
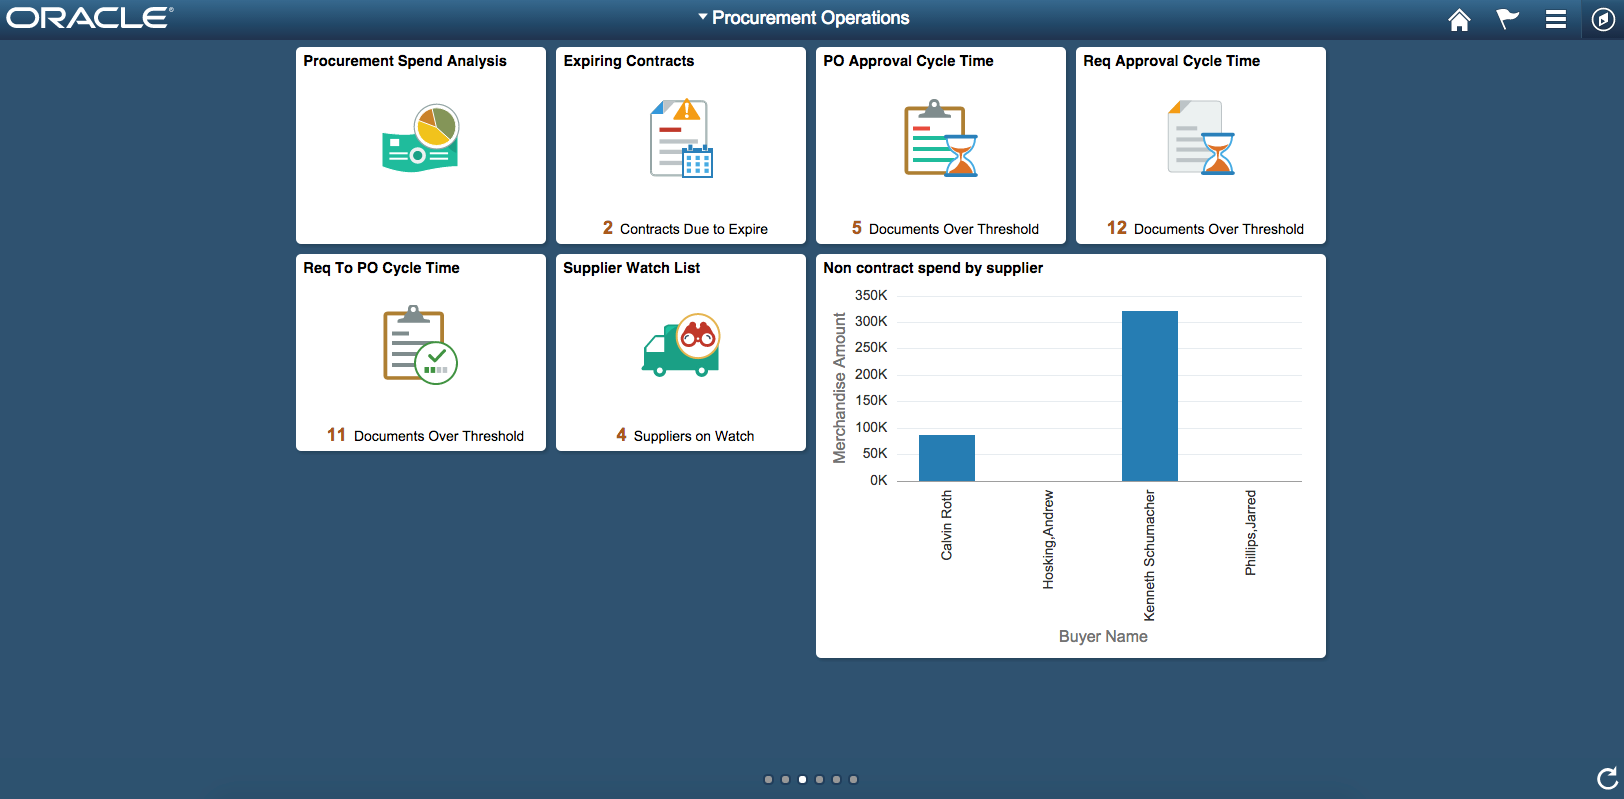
Confirm that the homepage now displays the analytic report.
Image: Homepage displaying the analytic report tile
This example shows the homepage displaying the Non contract spend by supplier report as a 2x2 tile with the chart preview.
Click the analytic report tile to access the analytic report, which has the link used to access the application page source from which the report was created.
Image: Analytic report with application page source link
This example shows the analytic report with the Created from Supplier Watch List link at the top-left of the chart.
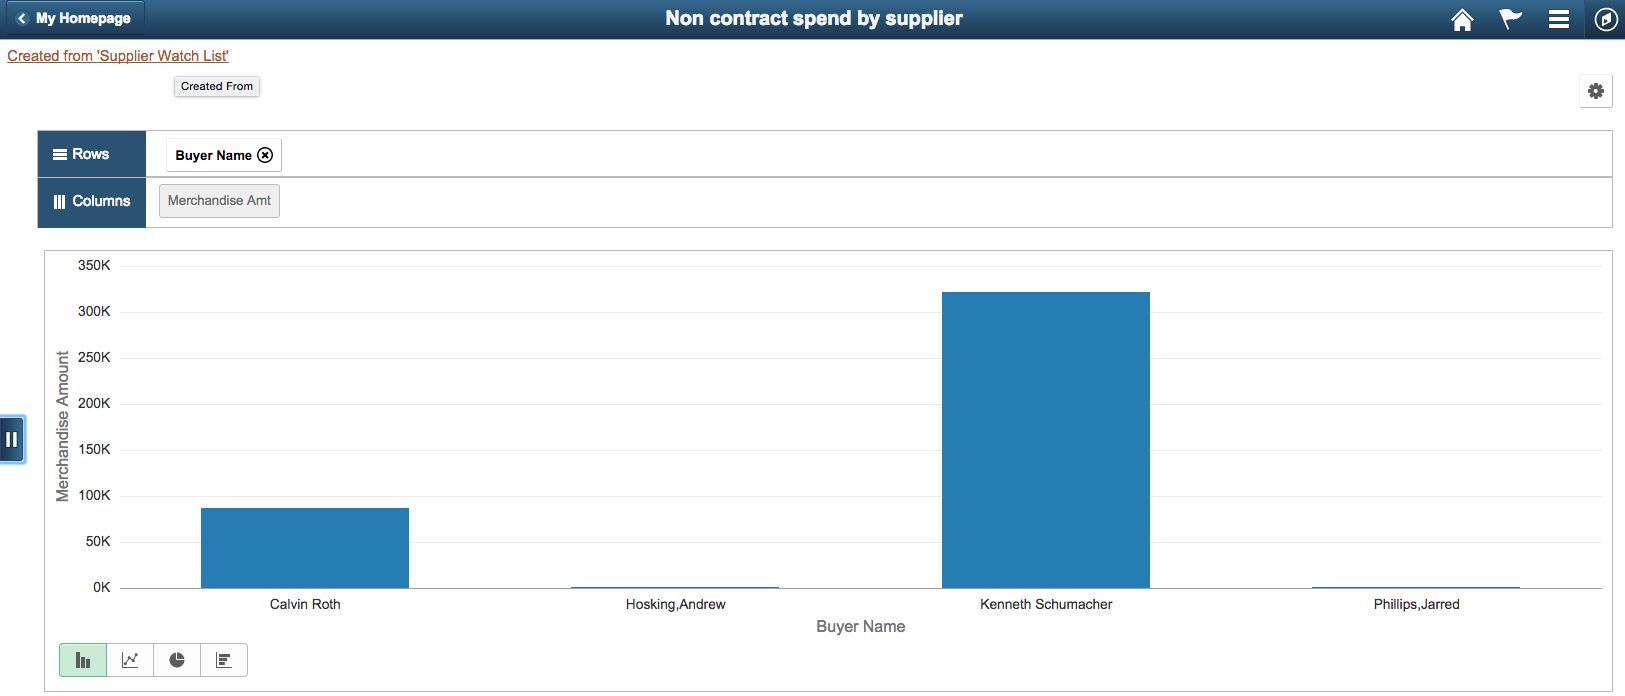
Click the application page source Created from Supplier Watch List link to access the page from which the report was created.
Image: Supplier Watch List after you click the application page source link
This example illustrates the Supplier Watch List after you click the Created from Supplier Watch List link from the previous example.
Note: You can add an analytic report once to any homepage. If the report is already added to the homepage and you attempt to add the report again, you have the option to delete the report from the homepage and add it back to the homepage.
Note: Report creator is able to edit, delete, or save the analytic reports they created. Users who have access to administer published reports can use the Save As option to save a copy of the current analytic report to the My Analytics list, and then they can edit, delete, and save their copies of the analytic reports.
Follow these steps to edit the analytic reports as the report creator:
From the Supplier Watch list, click the analytic report link under the My Analytics section.
In this example, open the analytic report for the supplier CAMPER’S WAREHOUSE.
Click the Edit button to open the Edit Analytics Wizard – step 1.
Change the display options using the Display Option section.
In this example, change the Pivot Grid option to Yes.
Click the Next button to open the Edit Analytics Wizard - step 2.
Change the prompts and fields as needed.
Click the Next button to preview the analytic report. The analytic report displays the grid and the chart.
Save the analytic report.
Image: CAMPER’S WAREHOUSE Analytic report with grid and chart views
This example displays the analytic report with the grid and the chart views.
The next time you view this report, the system will display it using the saved view with both grid and chart.
Optionally, while viewing the report, you can:
Click the Expand All link at the top-right of the window or the All icons in the grid to view more detailed information.
Click a data point on the chart to drill down or to view the detailed information.
Use the Option Menu to update filters, change chart options, export data, save the report, copy the report (using the Save As button), and set the sort options.
Change the chart type to Pie, Line, or Horizontal Bar option.
Apply filters, change prompt value, and drag and drop dimensions in the grid.
Note: When you save the analytic report, the Add to Homepage button appears for all the users. For Pivot Grid administrator and Pivot Grid super user, in addition to the Add to Homepage button, the Publish Options button is also available.
Follow these steps to publish the analytic report (as an administrator or a super user):
From the Supplier Watch list, click the analytic report link under the My Analytics section.
Click the Edit button to open the Edit Analytics Wizard - step 1.
Optionally, change the display option in the Display Option section.
Click the Next button to open the Edit Analytics Wizard - step 2.
Optionally, change the prompts and fields for the analytic report.
Click the Next button to preview the analytic report.
Save the analytic report.
Click the Publish button to display the Publish Options window.
Image: Publish Options window
This example illustrates the Publish Options window after you click the Publish button.
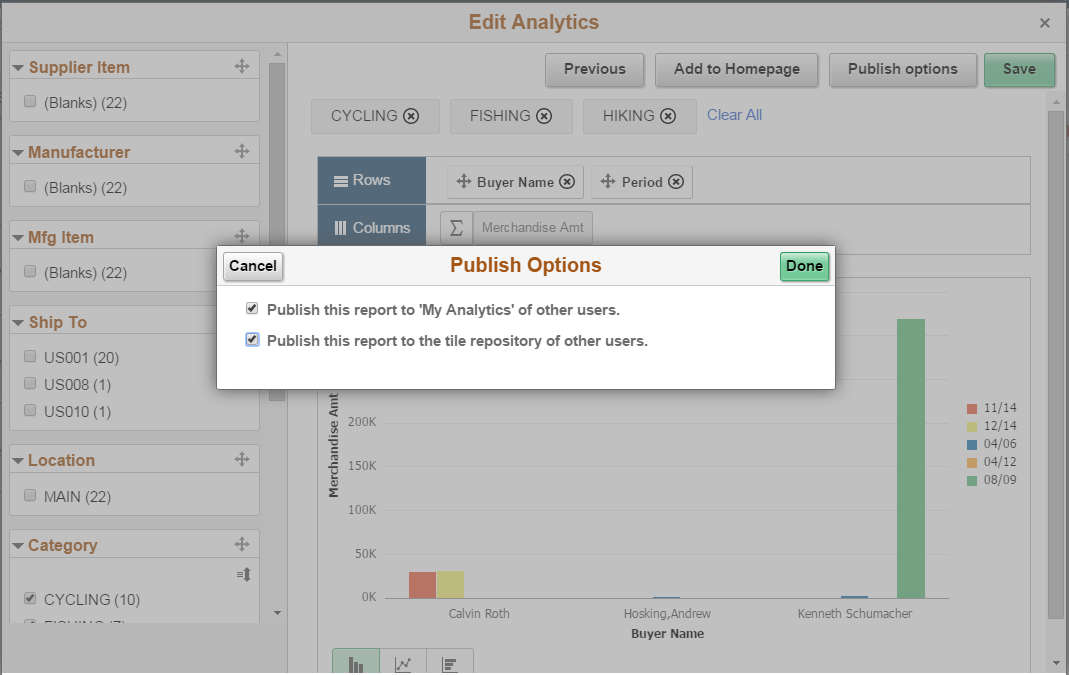
Select the publishing options.
Select the Publish this report to ‘My Analytics’ of other users option to publish the current analytic report and display it in the My Analytics section of all other users of the component.
Note: The current analytic report will be available for other users only if they have access permission to the underlying query that is used with the analytic report template.
Select the Publish this report to the tile repository of other users option to publish the current analytic report and display it as a tile under the Analytics folder for all users of the component, including the analytic report creator. Then these users can add the published tile into their fluid landing pages using the Add Tile option from the Action List\Personalize menu.
Note: To disable the Publish this report to the tile repository of other users option in the Publish Options window, deselect the When used as analytics template, allow created reports to be accessed outside the component context option in Pivot Grid Wizard - Specify Data Model Options page - Fluid Mode Options section.
See Fluid Mode Options.
Click the Done button to publish the analytic report.
The analytic report is successfully published.
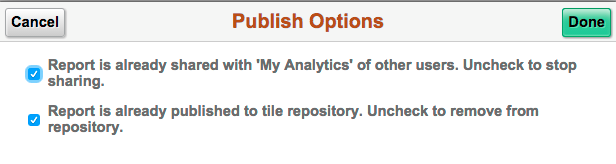
Note: If the analytic report is already published and you click the Publish Options button again, you have the options to stop publishing the analytic report and to remove the analytic report from the tile repository.
Image: Publish Options window
This example shows the Publish Option window displaying the options used to stop publishing the analytic report and to remove the analytic report from the tile repository.
Note: For more information on how to control report access using authorization service, see Developing Request Messages for the Security Authorization Service.
To add a published analytic report to the landing page as an administrator or super user:
Click the Action List button at the upper-right of the fluid homepage.
Select the Personalize option.
Click the Add Tile button on the Personalize Homepage page.
Select the analytic report from the Analytics folder.
Note: The Analytics folder will not be listed if there are no published reports available for the current user.
Click the Save button.
The analytic report appears in the fluid homepage.
Optionally, click the analytic report tile to open it in the fluid Pivot Grid Viewer.
To create a multi-dimensional analytic report:
In the Create Analytics Wizard - step 1, set the analytic report to Grid Only or Grid and Chart.
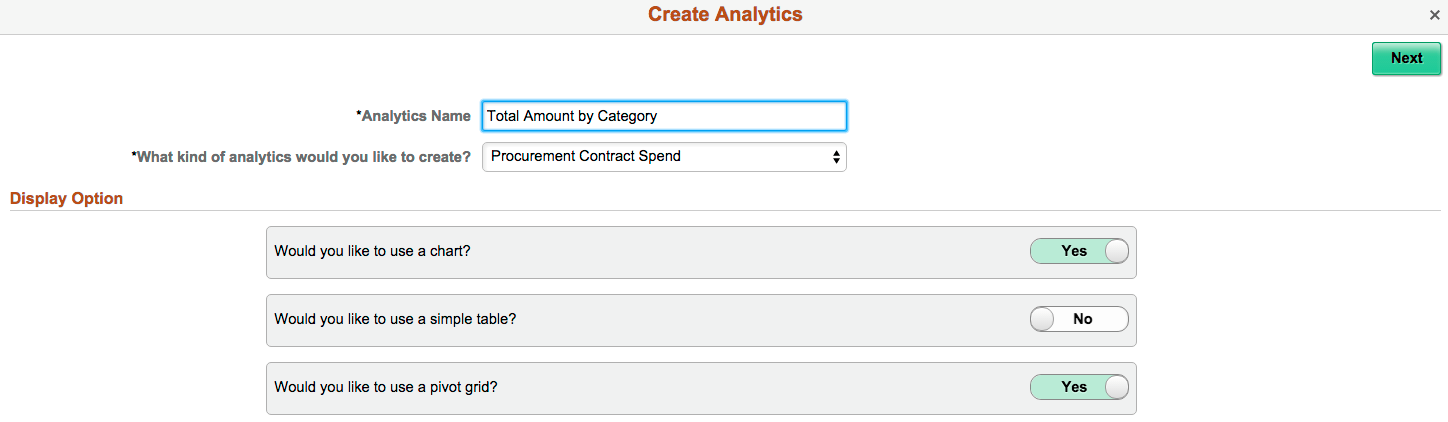
Image: Create Analytics Wizard - step 1 - Total Amount by Category
This example shows the Create Analytics Wizard - step 1 for the analytic report Total Amount by Category. The display options are set to Grid and Chart.
In the Create Analytics Wizard – step 2, select the fields and prompt values. If prompts are mapped, they will be passed as in the chart view.
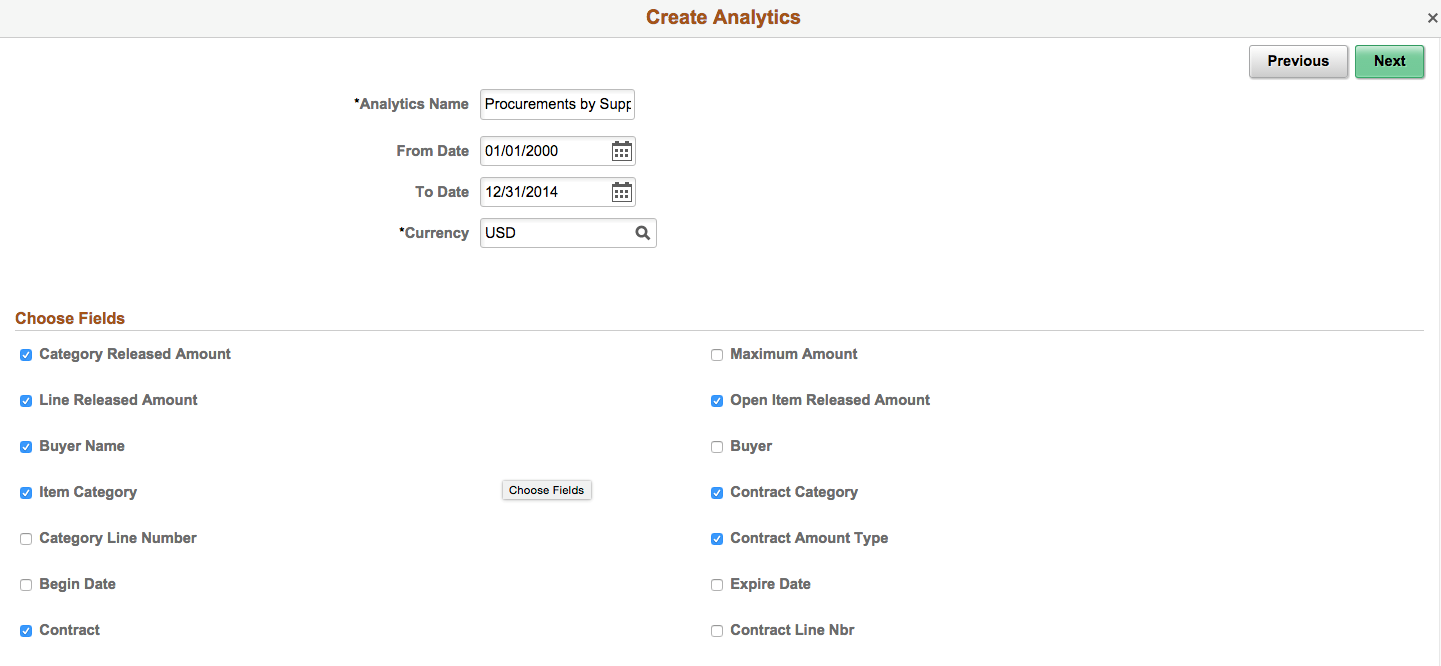
Image: Create Analytics Wizard – step 2 – Total Amount by Category
This example shows the Create Analytics Wizard – step 2 for the analytic report Total Amount by Category.
In the Create Analytics Wizard – step 3, preview and save the multi-dimensional analytic report.
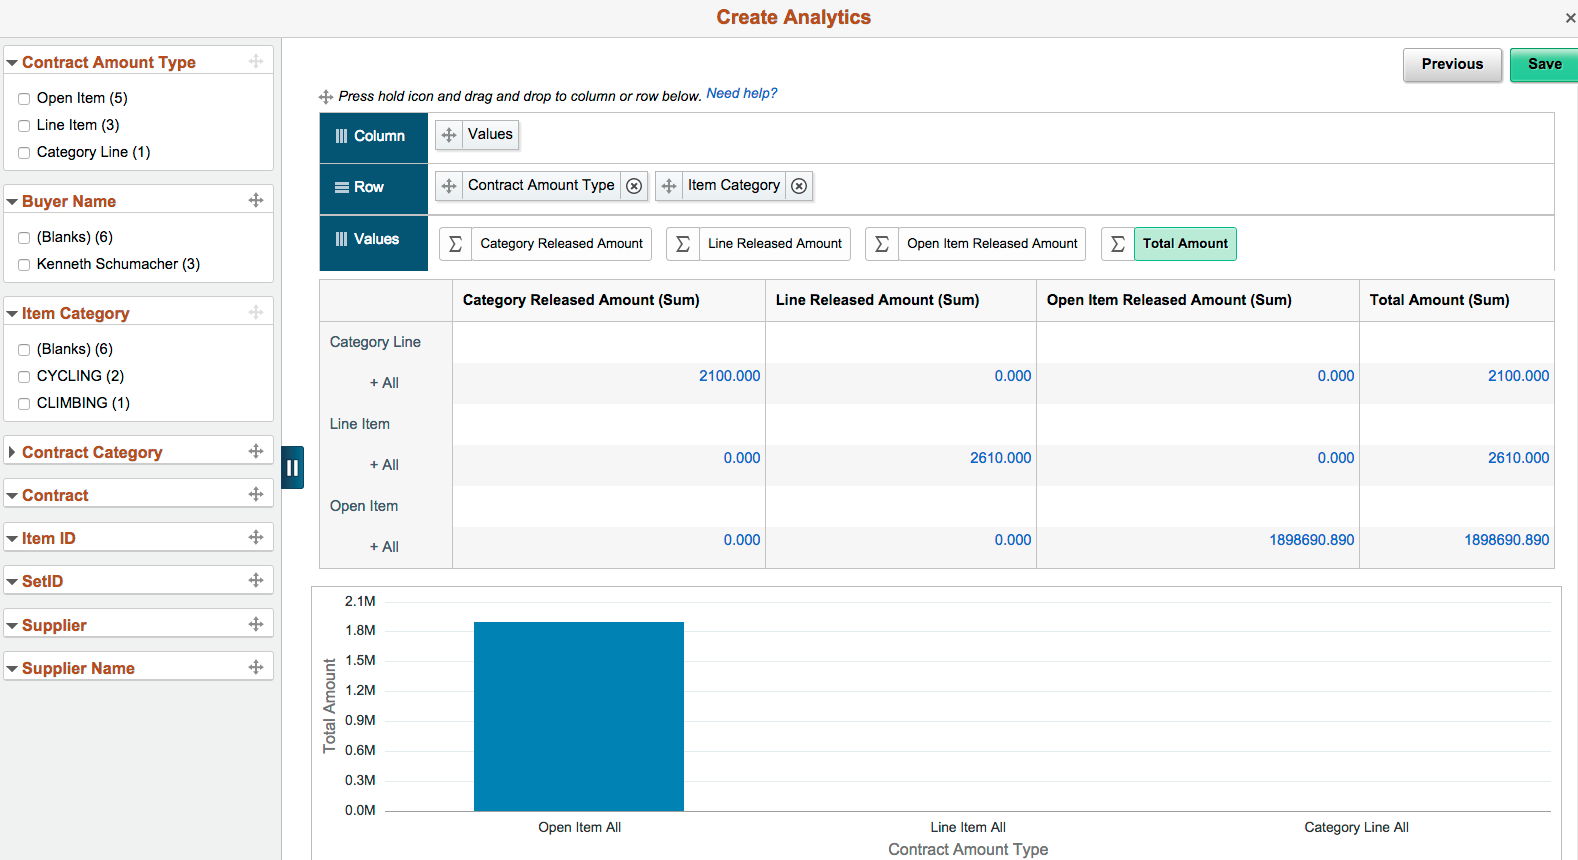
Image: Create Analytics Wizard – step 3 - Total Amount by Category
This example illustrates the analytic report Total Amount by Category displaying multi-dimensions.
Change the layout of the analytic report by dragging the facets to rows and columns or by dragging dimensions between rows and columns.
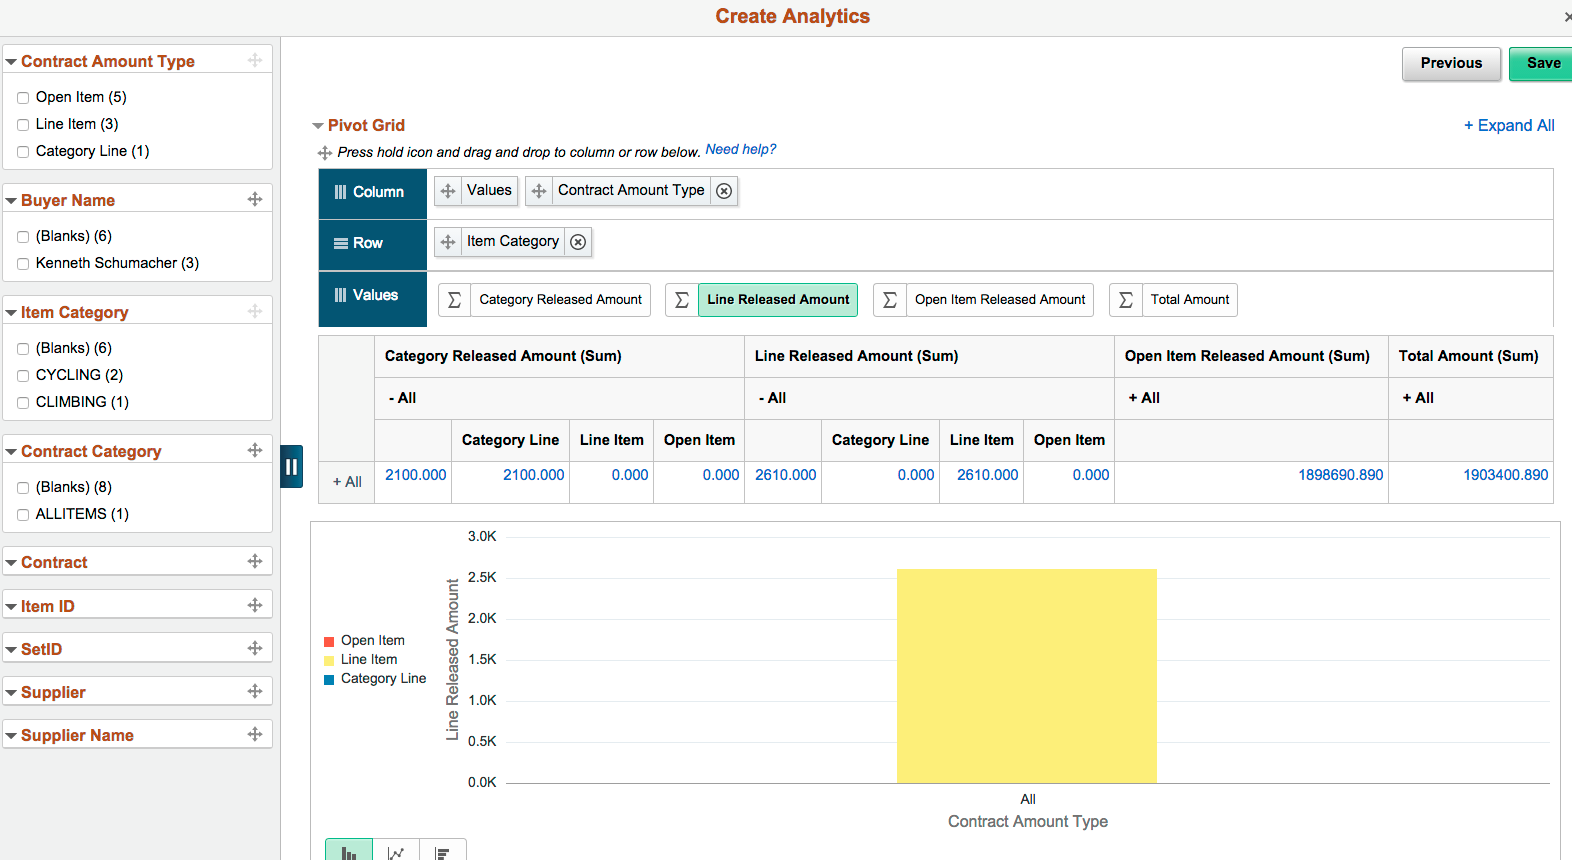
Image: Analytic report Total Amount by Category
This example illustrates the analytic report Total Amount by Category. The Contract Amount Type was dragged from the Rows area to the Columns area.
Change the aggregate values by selecting the Aggregate (or sigma) icon next to the facet.
Image: Analytic report Total Amount by Category
This example illustrates the analytic report Total Amount by Category. The Aggregate icon is selected and you are able to select an aggregate value from the list of available values.
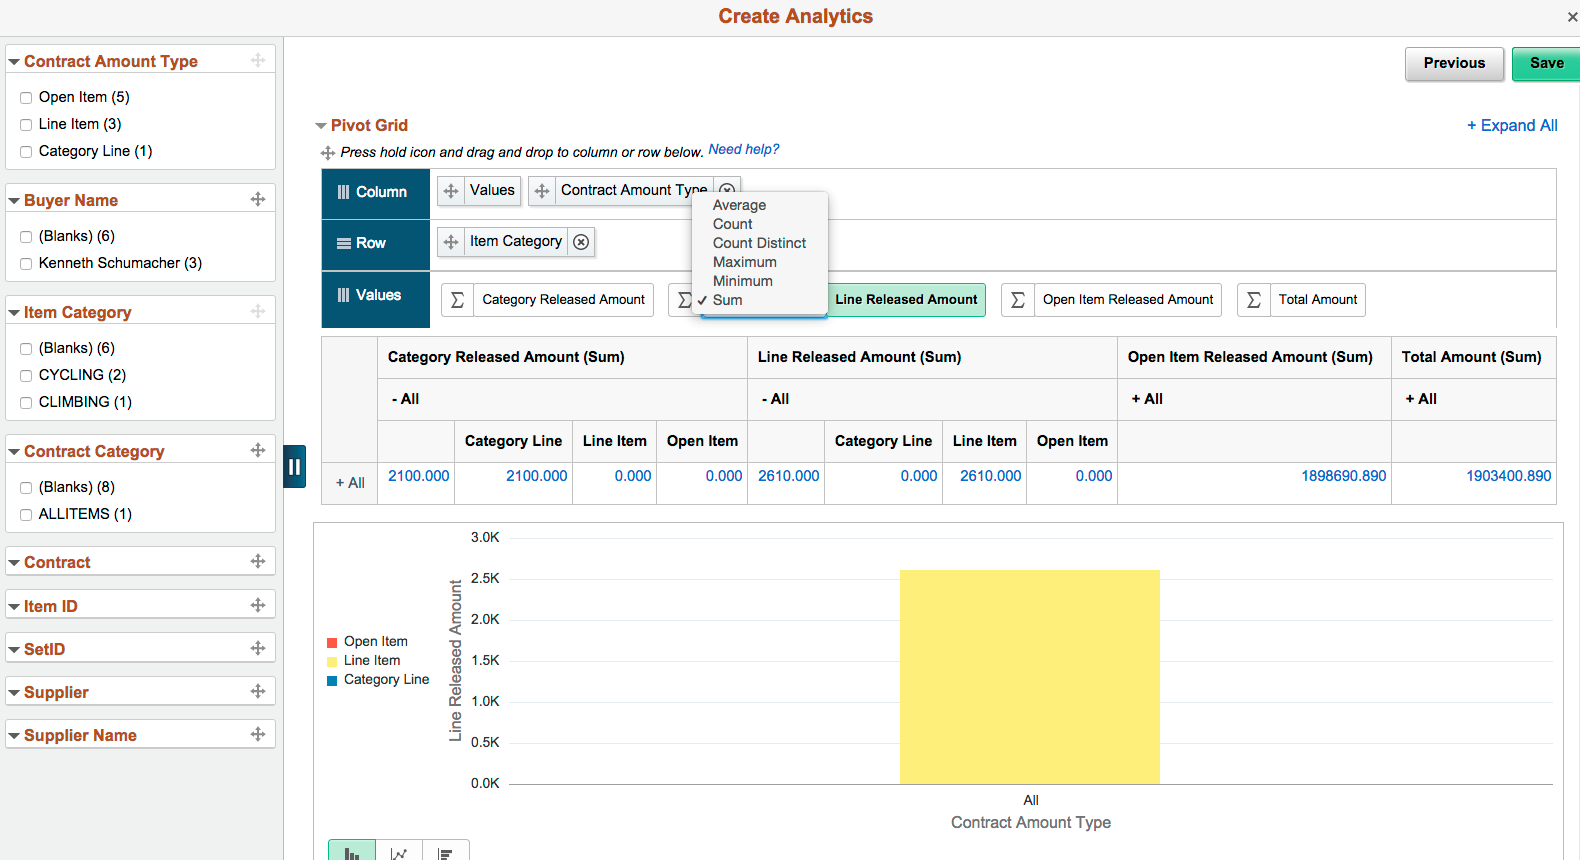
Image: Simple Table View
This example illustrates the analytic report Total Amount by Category when the display option are set to Simple Table.
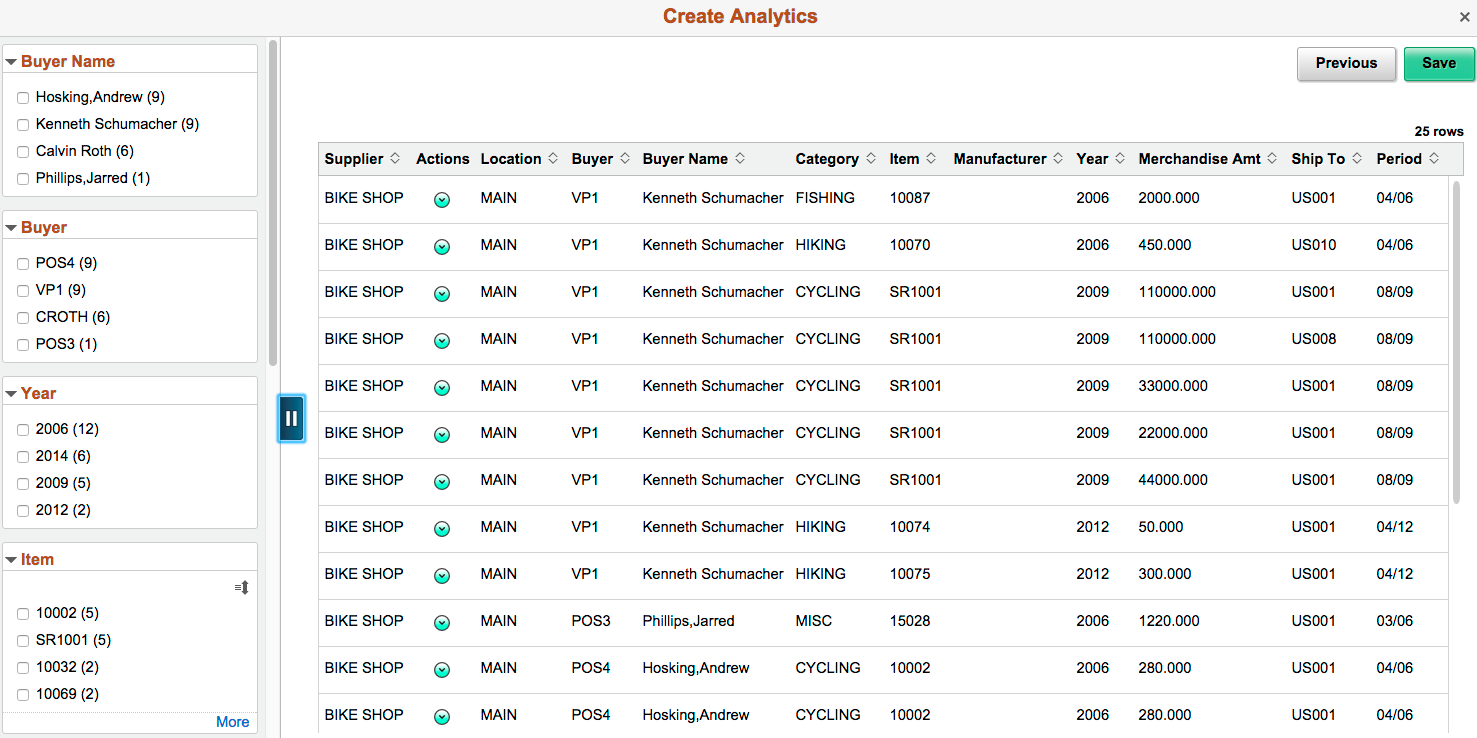
Image: Chart and Simple Table View
This example illustrates the analytic report Total Amount by Category when the display options are set to Chart and Simple Table.