Performing Actions on the Pivot Grid and Chart View
Following examples use the PS_QE_BAM_FACT_TBL record that stores Unit Sales, Unit Cost, and Product Sales for a set of regions and products, monthly.
Consider a Pivot Grid model built for this PSQuery with the following initial metadata:
Model:
Region, Product, and Month are axis columns.
Region and Product have All members defined.
Unit Cost, Unit Sales, and Product Sales are Value columns.
All the Value columns have the aggregate function Sum defined for them.
Grid:
Region and Product are on the row axis.
Month is on the Filter axis.
Values for No. of Units Sold, Unit Cost, and Product Sales are on the column axis.
Chart:
Region is on the X axis.
Unit Cost is on the Y axis.
Month is on the Filter axis.
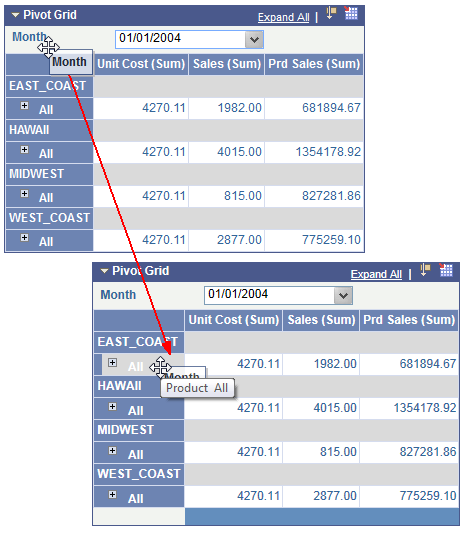
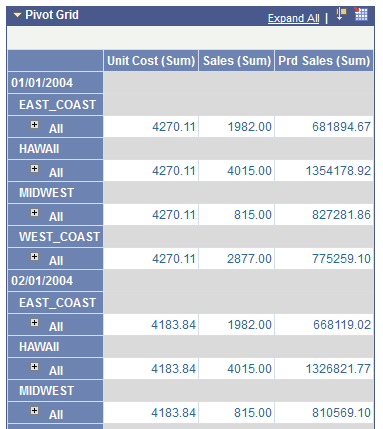
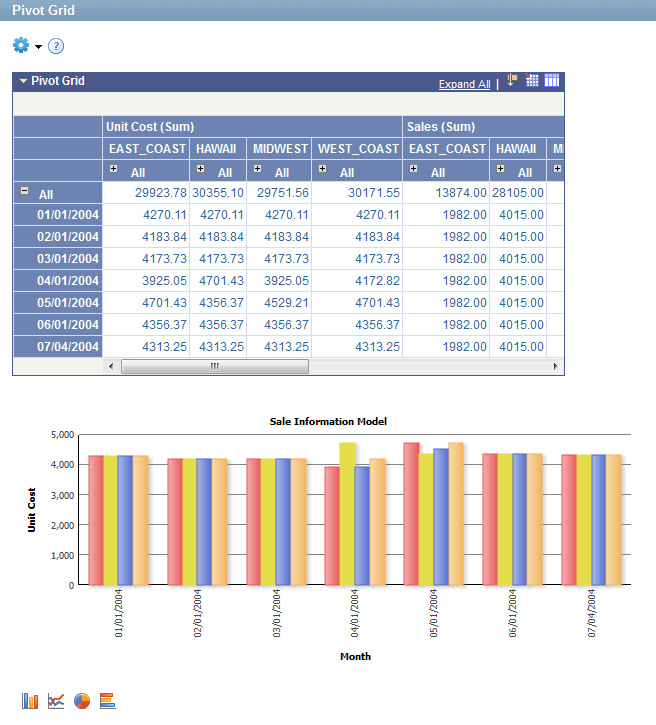
The above metadata generates the following pivot grid view.
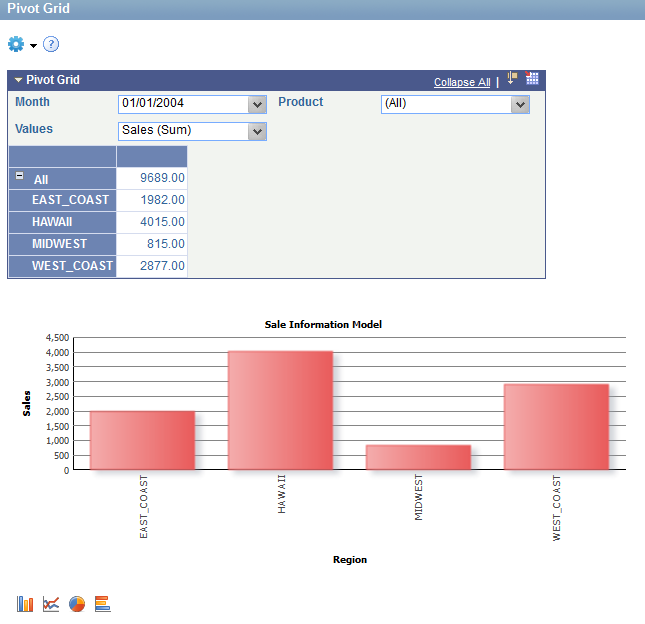
Image: Example of pivot grid and chart based on the Pivot Grid model
This example displays the pivot grid and chart based on the Pivot Grid model.
To drill down on the grid, you click the + (plus) icon. You drill down on the grid based on the row axis members. In this example, the user clicks the + icon under EAST COAST. The following actions are performed:
Execute the PSQuery to retrieve (1) the unique list of all the axis columns values (including Region, Product, and Month), (2) the Totals of Aggregate values for products for each region for the selected month, and (3) individual product information for the region that you are drilling down into.
Use the axis information and the rowset to set the initial grid layout.
Use the layout information and the PSQuery output to render the grid.
The following action is performed for the chart:
Retrieve the axis information for the selected model.
Use the output data from running the grid PSQuery.
Set the X axis of the chart to the Region field and the Y axis of the chart to the Unit Cost field.
Plot the chart.
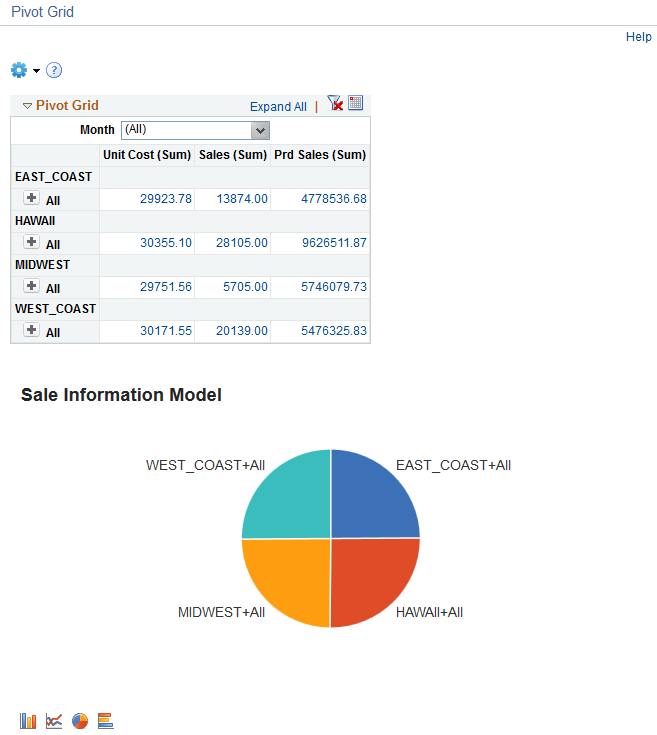
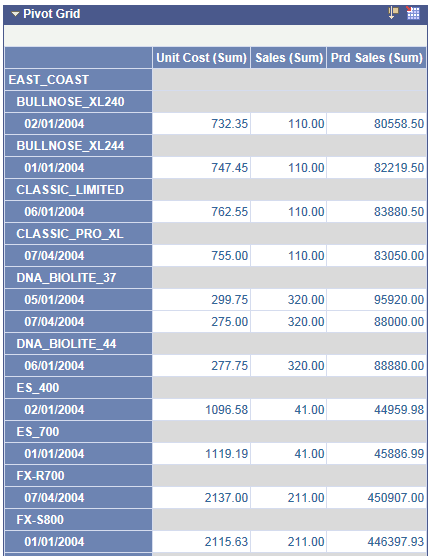
Image: Example of grid and chart after performing drilldown on region EAST COAST
This example displays the grid and chart drill-down based on the Pivot Grid model.

If you view aggregate data—for example, SUM, AVG, COUNT, and so on—you can drill down to view the data that comprise the aggregate value displayed in the grid and chart by clicking a value in the grid or chart.
While performing drill down on the aggregate values, note that:
To drill down on the Pivot Grid charts, you must enter an authentication domain either when you set up the PeopleSoft Pure Internet Architecture or in the Web Profile page. See “Configuring General Portal Properties” in Configuring Web Profiles.
When you move the mouse over the value numbers, they appear as underlined links.
Image: Example of Drill-Down on Aggregate Values
In this example, when you move the mouse over the value number in the grid, the grid displays the value numbers as links and the embedded label appears to show the data points plotted in the grid.
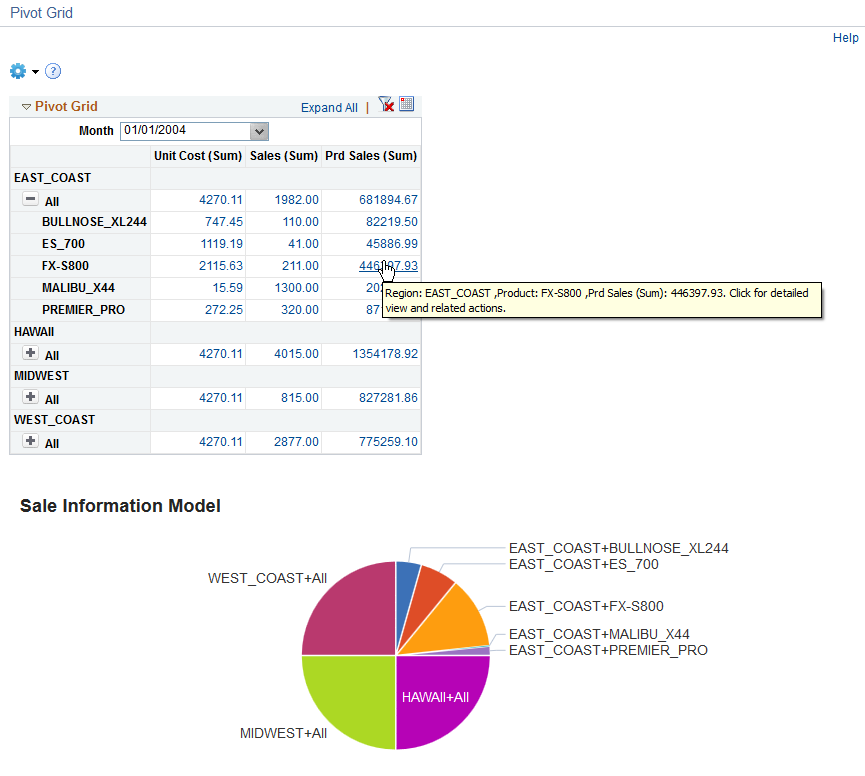
If there is no data returned for a particular intersection, 0 is displayed as a non-link text and you cannot drill down on that 0.
You can perform a drilldown on the aggregate values using either the Pivot Grid Viewer page or the Pivot Grid Wizard – Pivot Grid Displays page.
If related actions are not configured for the aggregate view, clicking the value number links on the grid or on the chart enables you to directly access the detailed view.
If related actions are configured for the aggregate view, clicking the value number links on the grid or on the chart populates a context menu with two options: Detailed View and Actions. You can click the Detailed View option to access the detailed view.
Image: Drill Down on Aggregate Values – Context Menu
This example shows a populated context menu that appears after you click a value link on the grid when the related actions are configured for the aggregate view.
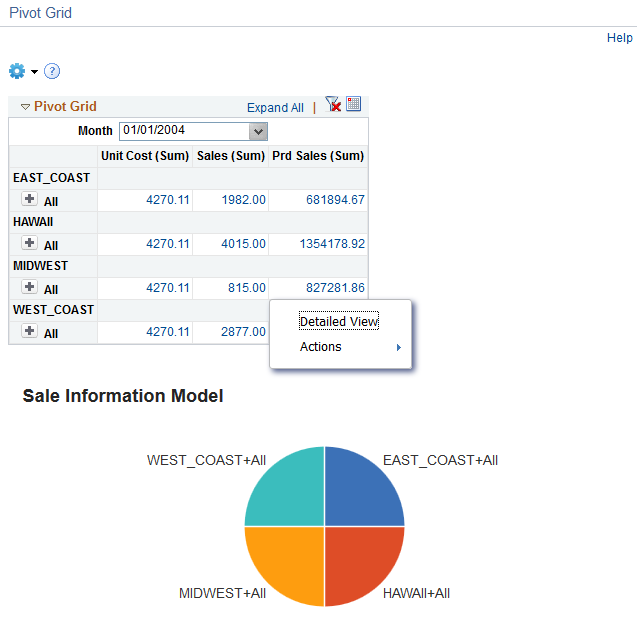
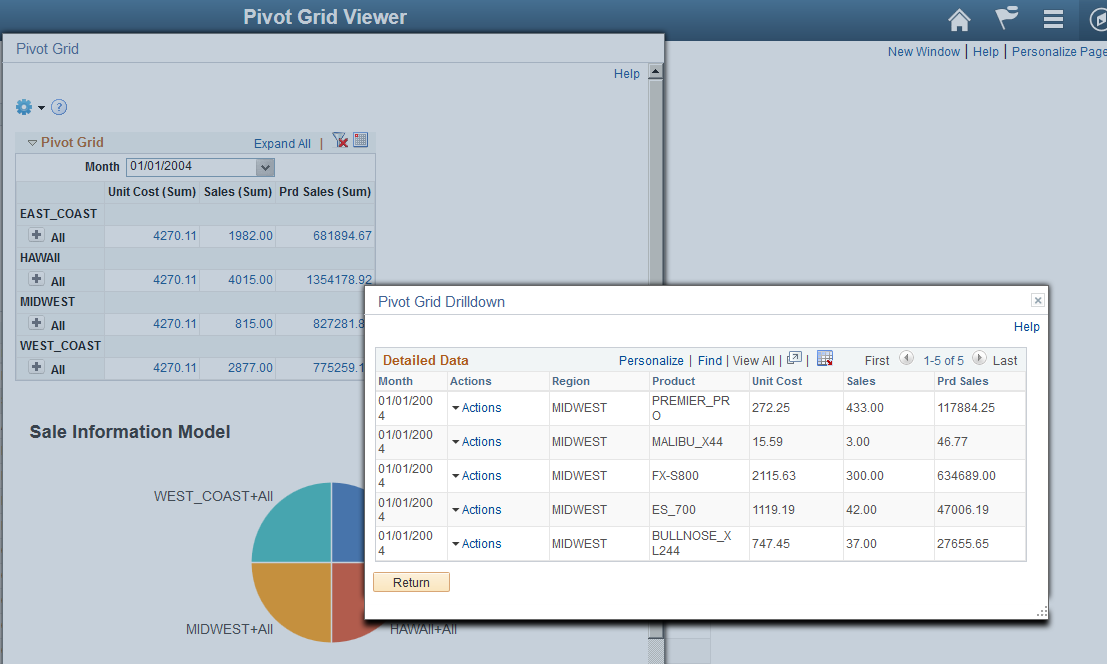
Image: Detailed View - Drill-Down on Aggregate Values
This example shows the results of drilling down on aggregate values.
See Using and Configuring the Related Actions Menu.
To perform a drill-down on aggregate values using the Pivot Grid Viewer page:
Select Reporting Tools, Pivot Grid, Pivot Grid Viewer.
Search for and open a Pivot Grid model.
Hover over number value to convert it to a link.
If related actions are configured, click the link to generate a PSQuery.
In the PSQuery, no aggregation functions are added to the facts. Also, the dimension values corresponding to the fact column are added as a filter to the PSQuery using the WHERE clause.
View the result set of the PSQuery in a modal window.
By clicking the data point on the chart, you can also drill down on aggregate values in the chart to view the detailed data that represents the chart data point; for example, a bar, a pie section, a line chart data point, and so on. If related actions are configured for the aggregate view, clicking the data point on the charts populates a context menu with three options: Detailed View, Drilldown To, and Actions.
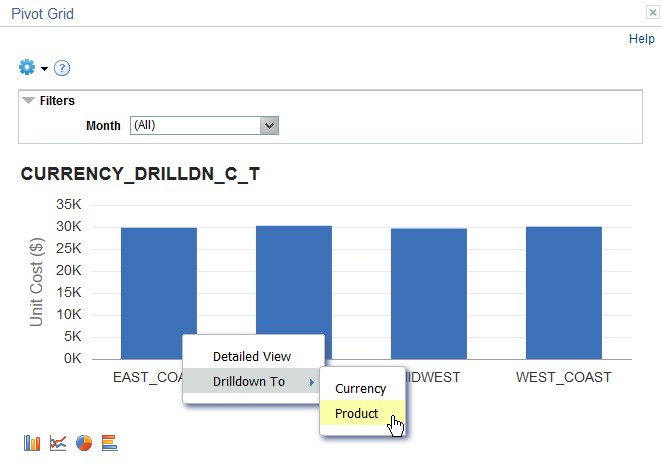
Image: Drilldown To option
This example shows the Drilldown To option that enables you to select the axis value used to drill down.
To drill down on the aggregate values in a grid when related actions are not configured for the Pivot Grid model:
Select Reporting Tools, Pivot Grid, Pivot Grid Viewer.
Search for and select a Pivot Grid model to view.
Move the mouse over a value number in the grid.
The value number changes to an underlined link.
Click the number value link.
The grid displays a page showing data that corresponds to the number value link that you clicked.
Click the Return button to close the page that contains the grid.
To drill down on the aggregate values in a GRID when related actions are configured for the Pivot Grid model:
Select Reporting Tools, Pivot Grid, Pivot Grid Viewer.
Search for and select a Pivot Grid model to view.
Move the mouse over a value number in the grid.
The value number changes to an underlined link.
Click the number value link.
Pivot Grid populates a context menu with two options: Detailed View and Actions.
Click the Detailed View option.
The grid displays a page showing data that corresponds to the number value link that you clicked.
Click the Return button to close the page that contains the grid.
To drill down on the aggregate values on a CHART when related actions are configured for the Pivot Grid model:
Access either the Pivot Grid Wizard or Pivot Grid Viewer page.
Open a Pivot Grid model that has the Chart Only view.
Click the chart data point.
Pivot Grid populates a context menu with three options: Detailed View, Drilldown To, and Actions.
Click the Detailed View option.
A window appears displaying all the values that correspond to the selected aggregation.
To drill down on aggregate values on a CHART when related actions are not configured for the pivot grid model:
Access either the Pivot Grid Wizard or Pivot Grid Viewer page.
Open a Pivot Grid model that has the Chart Only view.
Click the chart data point.
Pivot Grid populates a context menu with two options: Detailed View and Drilldown To.
Click the Detailed View option.
A window appears displaying all the values that correspond to the selected aggregation.
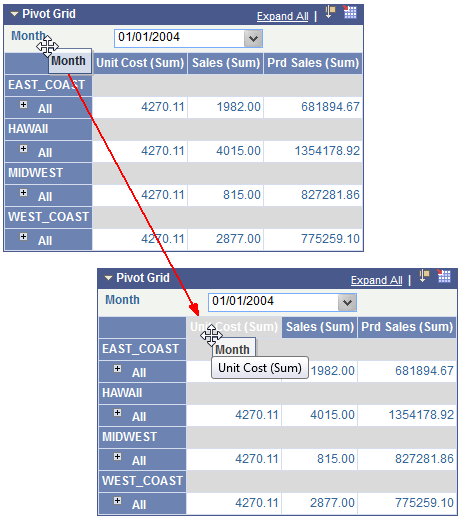
Image: Example of dragging the Month filter to column
To move the Month field to the column axis, click the Month and drag it to the column axis.
Execute the PSQuery to retrieve (1) a unique list of all the axis columns values (including Region, Product, and Month) and (2) the Totals of Aggregate values for products for each region for all of the months.
Use the axis information and the rowset to set the initial grid layout.
Use the layout information and the PSQuery output to render the grid.
The following actions are performed on the chart:
Retrieve the axis information for the selected model.
Use the output data from running the grid PSQuery.
Set the X axis of the chart to the Region field and the Y axis of the chart to the Unit Cost field.
Set the chart series axis to the Month field.
Image: Example of report filter on the column axis
This example shows the report filter moved to the column axis.
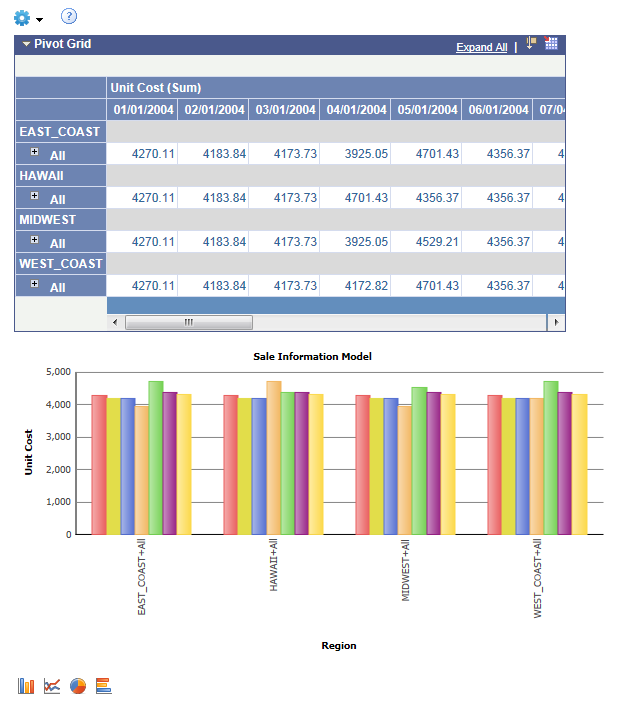
Image: Example of dragging a report filter to the row axis
This example shows how to move the Month field to a row axis by clicking the Month and drag it to the X axis.
Because the Month field does not have the All member associated with it, the grid plots all the values.
Execute the PSQuery to retrieve (1) a unique list of all the axis column values (including Region, Product, and Month) and (2) aggregate values for all the region, product, and month values.
Use the axis information and the rowset to set the initial grid layout.
Use the layout information and the PSQuery output to render the grid.
Image: Example of report filter in a grid moved to the row axis
This example shows a portion of the grid view when the report filter is moved to the row axis.
The following actions are performed for the chart:
Retrieve the axis information for the selected model.
Use the output data from running the grid PSQuery.
Set the X axis of the chart to the Region field and the Y axis of the chart to the Unit Cost field.
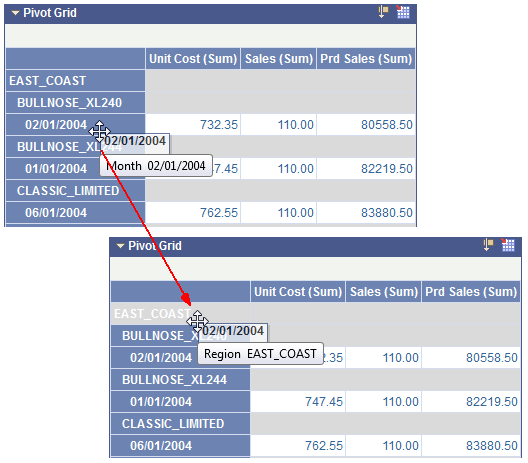
Image: Example of the result of moving the report filter in a chart to the row axis
This example shows the result of moving the report filter in a chart to the row axis.
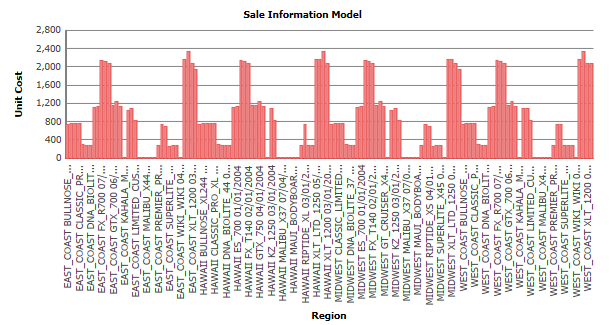
Image: Example showing how to change the dimension level
In this example, Month is changed to the highest dimension level by dragging the month up on the X axis.
The following actions are performed on the grid:
Execute the PSQuery to retrieve (1) a unique list of all the axis columns values (including Region, Product, and Month); (2) the totals of aggregate values for each month, for all the regions, for all the products because the grid is collapsed initially; and (3) the list of Unit Cost Values for each month and region for all the products, which if the grid is expanded requires an additional PSQuery.
Use the axis information and the rowset to set the initial grid layout.
Use the layout information and the PSQuery output to render the grid.
Image: Example grid displaying new dimensions
This example shows a portion of the grid after changing the dimension level.
The following actions are performed for the chart:
Retrieve the axis information for the selected model.
Use the output data from running the grid PSQuery.
Set the X axis of the chart to the Month field and the Y axis of the chart to the Unit Cost field.
Image: Example chart display after changing the dimension level
This example shows the entire chart after changing the dimension level.
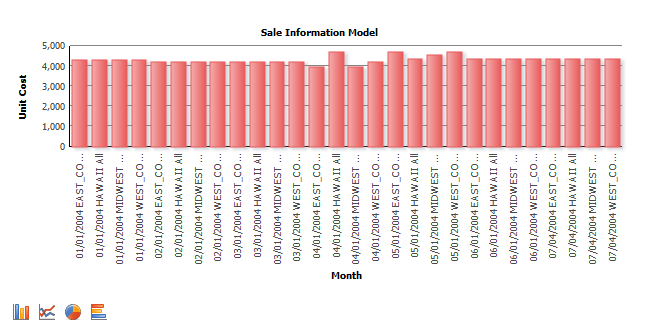
Image: Example of how to drag rows to columns
In this example, the Region field has All (Total) enabled. The Region field was moved to columns.
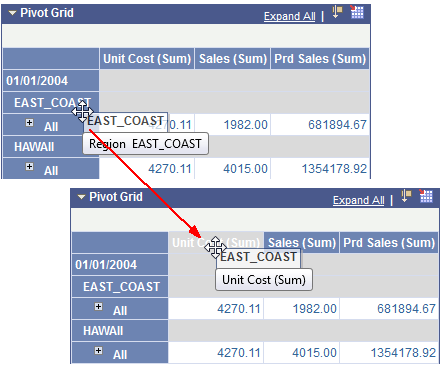
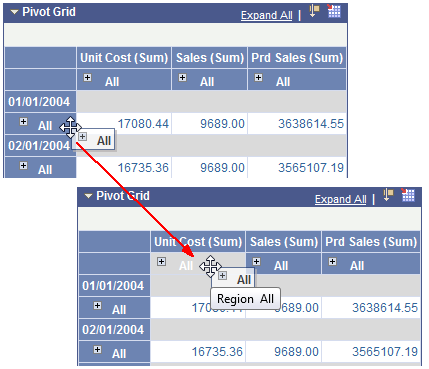
Image: Example of how to drag rows to columns
In this example, the Product field has All (Total) enabled. The Product field was moved to columns.
Execute the PSQuery to retrieve (1) a unique list of all the axis columns values (including Region, Product, and Month); (2) the totals of aggregate values for each month, for all the regions, for all the products because the grid is collapsed initially; and (3) the list of Unit Cost Values for each month and region for all the products, which requires an additional PSQuery if the grid is expanded.
Use the axis information and the rowset to set the initial grid layout.
Use the layout information and the PSQuery output to render the grid.
The following actions are performed for the chart:
Retrieve the axis information for the selected model.
Use the output data from running the grid PSQuery.
Set the X axis of the chart to the Month field and the Y axis of the chart to the Unit Cost field.
Add a combination of the Region and Product fields as a chart series.
Image: Example of grid and chart after moving rows to a column
This example displays the initial grid and chart after moving the rows to a column.
In this example, using the initial layout, we move both the Month and the Product fields from a row to the report filter. If the Product and Month fields are moved to the report filter, then data is additionally filtered based on the Product and Month fields.
Run the PSQuery to retrieve (1) a unique list of all the axis columns values (including Region, Product, and Month) and (2) the aggregate values for each region based on the selected month and product values.
Use the axis information and the rowset to set the initial grid layout.
Use the layout information and the PSQuery output to render the grid.
The following actions are performed on the chart:
Retrieve the axis information for the selected model.
Use the output data from running the grid PSQuery.
Set the X axis of the chart to the Region field and the Y axis of the chart to the Unit Cost field.
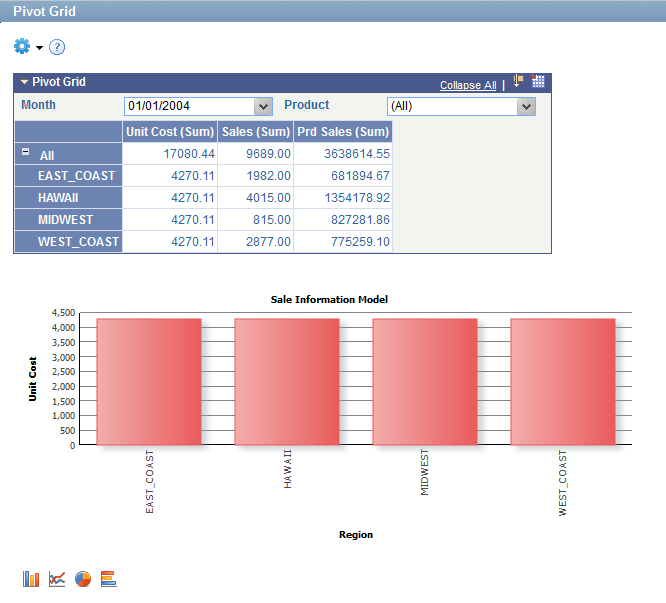
Image: Example grid and chart based on month and product filters
This example shows the grid and chart with values displayed. The values are based on the grid filter, which is the unit cost for all product for 01/01/2004 by region.
Changing the report filter value will result in filtering of the data in the grid. The following actions are performed for the grid:
Execute the PSQuery to retrieve (1) totals of aggregate values for all the products for each region for the selected month and (2) the unique list of all the axis values, including Region, Product, and Month.
Use the axis information and the rowset to set the initial grid layout.
Use the layout information and the PSQuery output to render the grid.
The following actions are performed to display the chart:
Retrieve the axis information for the selected model.
Use the output data from running the grid PSQuery.
Set the X axis of the chart to the Region field and the Y axis of the chart is automatically set to the Unit Cost field.
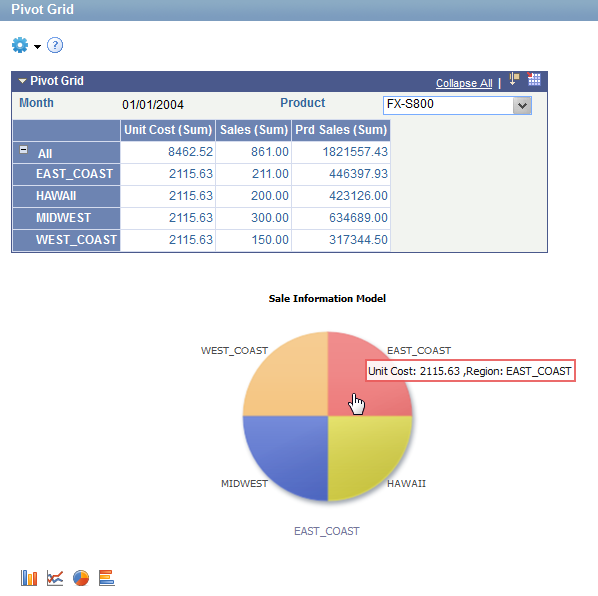
Image: Example grid and chart displayed with new values based on filters
This example displays the grid and chart for the filtered month and product. The Month filter has only one value and appears as a non-selectable value because Progressive Filtering is applied.
You are able to select multiple filter values in grids and in charts. Note that:
If all items in the filter drop-down list are selected, either the (All) label or the value in the Total Name column that you specified in the Pivot Grid Wizard - Specify Data Model Values page is shown.
If some items in the filter drop-down list are selected, the (Multiple items) label is shown.
If only one item in the filter drop-down list is selected, the label of the selected item is shown; for example, 01/01/2004.
If NULL values or empty values are in the table, the (Blanks) label is shown.
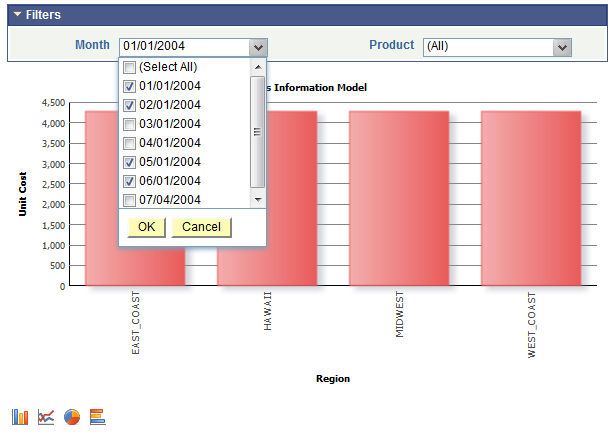
Image: Multiple filter options in grid
This example illustrates the filter drop-down list in the grid with multiple options.
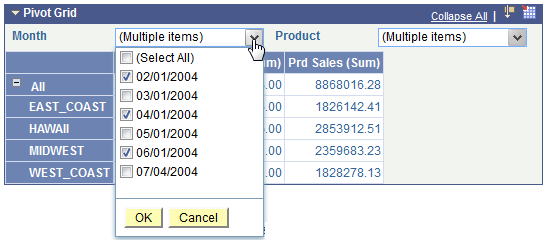
Image: Multiple filter options in chart
This example illustrates the filter drop-down list in the chart showing multiple options.
Note that:
When the Total option is selected for the Axis Column Type, Select All is listed as the first option in the filter drop-down list and the distinct values for the filter are listed following the Select All option.
The default selected value when you first use the filter is Select All.
When the Total option is not selected for the Axis Column Type; Select All is listed as the first option in the filter drop-down list, and the distinct values for the filter are listed after the Select All option.
The default selected value when you first use the filter is the first value following the Select all option
The text Multiple Items appears when more than one filter value was previously selected or when the Total—for example, Select All—was previously selected.
If only one value was previously selected, then that value appears.
If the selected filter has only one value in the list, then that value is shown in the filter instead of the text Multiple Items. The filter drop-down list is not displayed when only one item is available.
Selecting the Select All option selects all the values in the filter drop-down list.
Deselecting the Select All option deselects all the values in the filter drop-down list.
Clicking the OK button applies all changes that were made in the filter drop-down list and closes it.
The Pivot Grid is refreshed to indicate the data that corresponds to the selected filter values.
Clicking the Cancel button cancels all changes that were made in the filter drop-down list and closes it.
The grid is not refreshed.
When none of the values is selected in the filter drop-down list, clicking the OK button makes no changes.
The filter drop-down list in the Pivot Grid Viewer page and the Pivot Grid Wizard - Pivot Grid Display pages behave in a similar fashion.
The Chart Only view does not limit the number of filters.
When the filter name or the selected filter value is too long, they are truncated with ellipses.
You can hover over the filter name or filter value to view the full description as tool tip.
To select multiple filter values in a grid:
Select Reporting Tools, Pivot Grid, Pivot Grid Viewer.
Search for and select a Pivot Grid model for viewing.
Drag and drop a dimension to the filter area in the grid.
The selected filter text can be Values or Multiple Items based on your previous selection.
Click the filter drop-down list to view the filter values.
Each of the filter values has a corresponding check box, and each filter has a Select All option.
Select the Select All option to select all distinct items in the filter drop-down list.
Alternatively, select multiple values in the filter drop-down list.
Click the OK button to apply the filter changes, close the filter drop-down list, and refresh the grid so that it displays the data that corresponds to the selected filter values.
Alternatively, click the Cancel button to cancel the filter, close the filter drop-down list, and not refresh the data in the grid.
To select multiple filter values in a chart:
Access either Pivot Grid Wizard or Pivot Grid Viewer.
Open a Pivot Grid model that has the Chart Only view and one or more filter values.
Click the filter drop-down list and select the filter values.
Click the OK button to enable Pivot Grid to run the data.
The system renders the chart, which displays data based on the selected filter values.
Pivot Grid Progressive Filtering is functionality provided in the Pivot Grid where the selected filter values are updated in the list of values available for the filters after each filter is applied. When you perform filtering on a pivot grid or chart, the list of available filter values are progressively filtered based on your selections. This feature enables you to retrieve only relevant values for the filters so that they can be selected appropriately. For example, a selection of a particular geographical location filter value returns departments that are valid only for that location. Selecting a department will then return the list of employees that are valid for that department only.
Salient features of the Progressive Filter option are:
The filter values are progressively filtered, resulting in valid values for each filter that you can select.
The user-selected filter values are almost never changed, except when prompts are altered, resulting in a consistent user experience.
The filtering is consistent irrespective of whether totals are defined for the filter fields.
The behavior of Progressive Filtering is the same in the grid and in the chart.
The Progressive Filtering is reset when:
The Pivot Grid model is displayed for the first time without any user personalization.
Users change the prompt values or the prompt values are changed using IWC.
The following examples show the process of applying progressive filtering in drilling down on a chart:
Open the Current Headcount model in Pivot Grid Viewer or Pivot Grid Wizard.
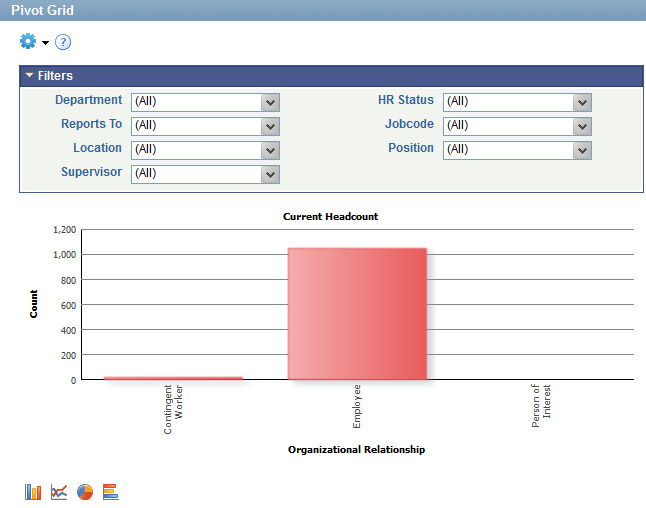
Image: Initial view of the Current Headcount model
This example shows the initial view of the Current Headcount model.
Select the California Location option in the Location filter.
All other filters are refreshed and the data are fetched based on the selected location.
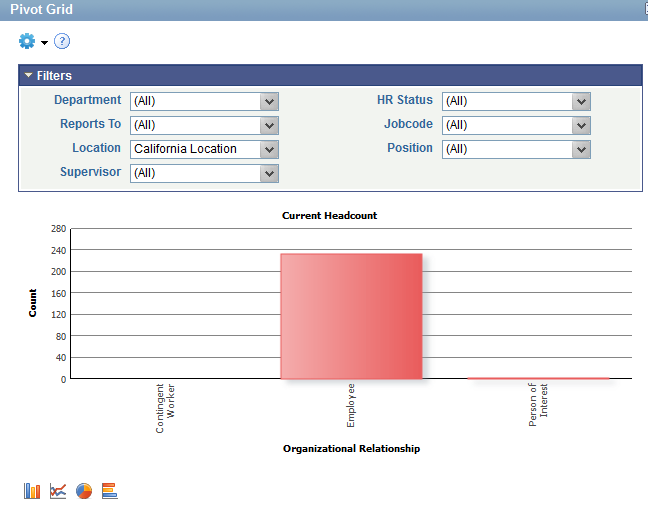
Image: Filter option is applied
In this example, the Current Headcount chart displays the data based on the selected location, California Location.
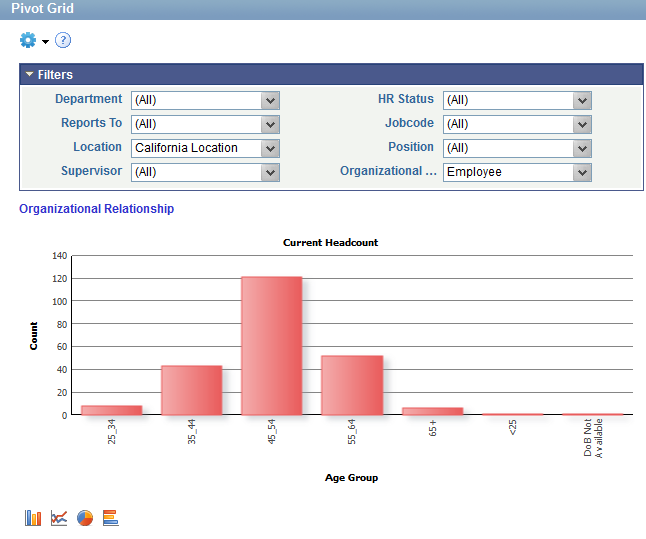
Click the Hire bar, select the Drill To option, and select the Age Group option.
Image: Results of drilling down on the field Age Group from the Employee bar
This example shows the results of drilling down on the field Age Group from the Employee bar.
The following table lists various use cases, expected behaviors, and exception scenarios for the Progressive Filtering feature.
|
Use Case |
Expected Behavior |
Exception Scenarios |
|---|---|---|
|
Grid is rendered with no user personalization. |
Filter values are retrieved as is. No primary filter criteria are applied. |
None |
|
Grid is rendered with user personalization. (User has saved the layout.) |
Filter values are retrieved based on the primary filter value that is saved by the user. The primary filter values are retrieved using a separate query. |
If the primary filter value, which is saved by the user, is invalid, the primary filter is ignored and the value is retrieved, assuming no primary filters are in place. |
|
User changes filter value in the grid. |
The changed filter value becomes the primary filter. All other filter values are retrieved based on the primary filter values. |
None |
|
User changes an additional filter value in the grid. |
The previous primary filter value is discarded. The current filter becomes the primary filter. User-selected filter values are retained. The list of selectable filter values are retrieved based on all user-selected filter values, including the primary filter. |
None |
|
User changes prompt values. |
The current primary filter, if any, is discarded and the filter values are retrieved as is. No primary filter criteria are applied. |
None |
|
User changes chart options to add new settings (for example, dimensions, filters, and so on) in a chart. |
The current primary filter, if any, is discarded only if it is removed or if it is added as an axis. The filter values are retrieved as is. No primary filter criteria are applied. |
None |
|
User drags and drops dimensions on the grid. |
If the primary filter is moved from the filter to the row or column, it is discarded. Otherwise, the primary filter criteria are used to retrieve the other filter values. |
None |
|
User saves the layout. |
The primary filter value is the last selected filter and is saved. |
If the user performed an action that discarded the primary filter (for example, changing prompts or dragging the primary filter to the row or column), then the primary filter is not saved. |
|
Grid is rendered using Related Actions. |
The primary filter value, if any, is discarded (because user provided multiple filters using bind parameters as related action parameters, thus complicating the process of determining a primary filter). |
None |
|
Grid filter values are changed using Inter Window Communication (IWC). |
Similar to a filter change, the current filter being changed by IWC becomes the primary filter and other filter values are retrieved using the current primary filter value. |
If the user previously used the grid to perform different filter actions (because the current filter value comes from IWC is invalid), then the filter value is ignored. |
|
Pivot Grid prompt values are changed using IWC. |
The current primary filter, if any, is discarded and the filter values is retrieved as is. No primary filter criteria are applied. |
None |
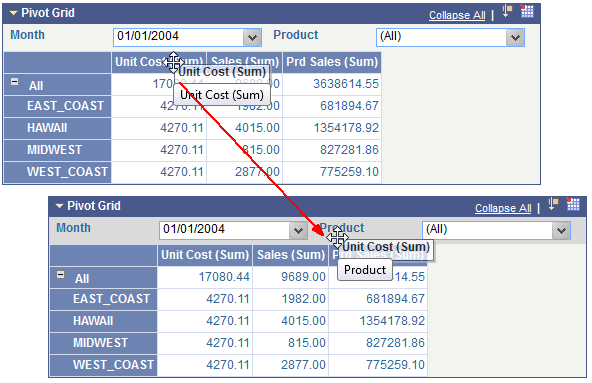
If you make a value field a filter, then you need to select the value that appears in the grid. This example uses the Unit Sales field as the selected value.
Image: Example of dragging a column to a report filter
This example illustrates dragging a column to a report filter.
Execute the PSQuery to retrieve (1) a unique list of all the axis columns values (including Region, Product, and Month) and (2) aggregate values for each region for all the products based on the selected month values.
Use the axis information and the rowset to set the initial grid layout.
Use the layout information and the PSQuery output to render the grid.
The following actions are performed to produce the chart:
Retrieve the axis information for the selected model.
Use the output data from running the grid PSQuery.
Set the X axis of the chart to the Region field and the Y axis of the chart is automatically set to the Unit Sales field.
Image: Example grid and chart displaying unit sales
This example shows the grid and chart for unit sales.