Specifying Data Model Values
Use the Specify Data Model Values page (PTPG_WIZ_MODEL) to define the column type and aggregate functions for the selected data model.
Navigation
Access the Specify Data Model Values page by selecting the Next button on the Select Data Source page.
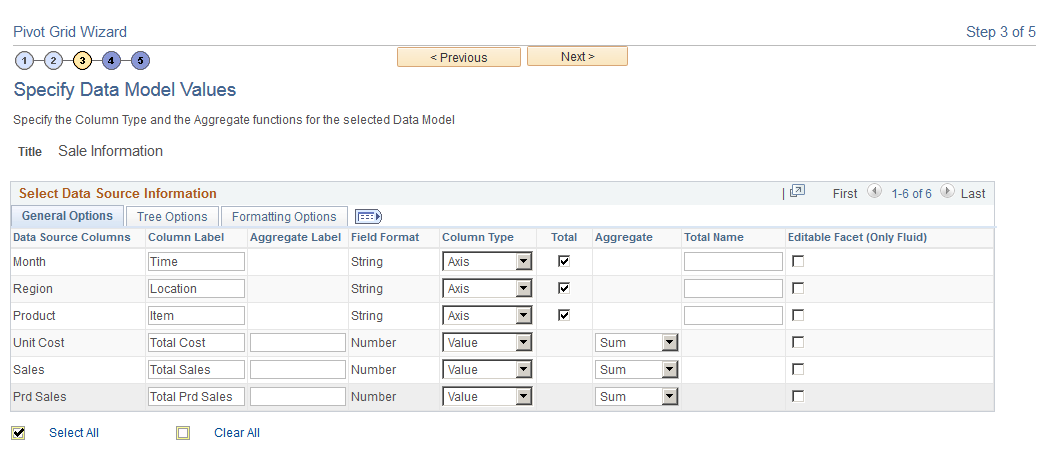
Image: Specify Data Model Values page
This example illustrates the fields and controls on the Specify Data Model Values page. Definitions for the fields and controls appear following the example.
|
Field or Control |
Definition |
|---|---|
| Column Label |
(Optional) Specify the labels for columns (dimensions/facts). The labels apply to grids and charts. Note: Column labels must be unique. No two data source columns can have the same label. |
| Aggregate Label |
(Optional) Enter the aggregate labels for the columns. These aggregate labels will be:
For example, the label of the Unit Cost column is set to Total Cost, the label of the Sales column is set to Total Sales, and the label of the Prd Sales column is set to Total Prd Sales.
The behavior of the Aggregate Label field is applied to both classic and fluid views. |
| Column Type |
Define the axis, value, or display members for a column. Select the Display option to enable the column to appear in the detailed-data view of the grid and the chart. Note: At least one Axis and one Value member are required. You can also select this column as a related action parameter for a Pivot Grid model in the detailed-data view. If the PSQuery formula is based on an expression and that expression is used in the Pivot Grid model, then:
|
| Total |
Select which Axis members have the Total (All) attribute enabled. Note: This column is available only for the data source column with column type Axis. |
| Aggregate |
Define the aggregate functions for the Value type members. Available options are Average, Count, Count Distinct, Maximum, Minimum, Sum, and None. Note: This column is only available for the data source column with column type Value. Value members of type Number and Signed Number can be associated with any of the aggregate functions. Value members of any other type can only be associated with the Count aggregate function. Count or Count Distinct aggregates are available for the fact fields that are set to character. If the PSQuery expression is based on a formula and that expression is used in the Pivot Grid model, then the type of the column should be set to Value, and the Aggregate value should be set to None to avoid multiple aggregations on the column |
| Total Name |
(Optional) Specify the total names, which override the default All string. |
| Editable Facet (Only Fluid) |
Select to enable the data source columns as editable facets (prompts) in fluid view. See Configuring Facets. |
| Next |
Click this button to advance the wizard to the next page. |
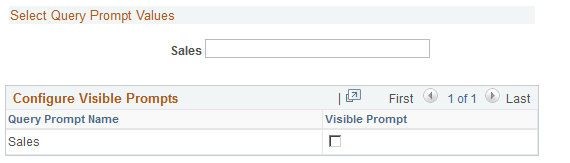
The Select Query Prompt Values region is only available when the selected query has prompts attached.
Image: Specify Data Model Values page - Select Query Prompt Values section
This example illustrates the fields and controls on the Select Query Prompt Values section. You can find definitions for the fields and controls later on this page.
|
Field or Control |
Definition |
|---|---|
| Select Query Prompt Values |
Enter the default values for the PSQuery runtime prompts. Note: The default value in the Select Query Prompt Values region is blank and you are able to define your prompt values. If the required prompt fields are blank or if the format of data entered is incorrect, Pivot Grid Wizard displays a validation error. |
| Configure Visible Prompts |
Select a check box in the Visible Prompt column for the query prompts that will be visible to the viewers. Otherwise, clear the Visible Prompt check box for the query prompts that will be hidden from viewers. If all prompts are set to be invisible, the Prompts option will not appear in the Options Menu in Pivot Grid Viewer. |
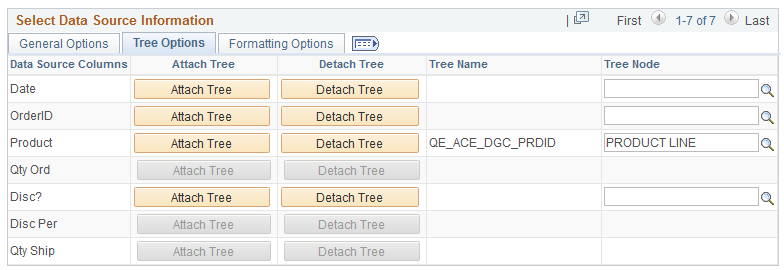
Image: Tree Options section
This example illustrates the fields and controls on the Tree Options section. You can find definitions for the fields and controls later on this page.
|
Field or Control |
Definition |
|---|---|
| Attach Tree |
Click to access the Attach Tree to Dimension window, where you can select a tree from a list of available trees and attach it to the dimension. Note: Only Summer Detail Trees that match the corresponding Axis are listed. |
| Detach Tree |
Click to detach a current PeopleSoft tree from the dimension. |
| Tree Name |
Display the tree names that you have selected using the Attach Tree button. |
| Tree Node |
This field is required. The Tree Node is populated with the Root node of the selected tree. However, this value can be changed to point to any node in the tree. The hierarchical information for the dimension is shown from this node only. |
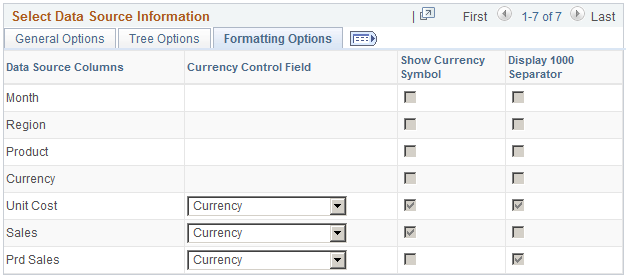
Image: Formatting Options section
This example illustrates the fields and controls on the Formatting Options section. You can find definitions for the fields and controls later on this page.
|
Field or Control |
Definition |
|---|---|
| Currency Control Field |
Select Currency field as the Currency Control Field. The decimal positions for the currency value are based on the currency control field. For example, two decimal positions appear for U.S. dollars or three decimal positions appear for the Brazilian real. Note: The query should include the Currency field as a Data Source Column to associate it as the Currency Control Field. These currency control fields can be associated with the columns set to Value and Display. |
| Show Currency Symbol |
Select to display the currency symbol for the columns that are set to Value. If this option is selected:
|
| Display 1000 Separator |
Select to display the 1000 separator for the Value. For example, the value of ten thousand dollars appears as $10,000.00. |
Note: If no value is set in the Formatting Options tab, the system displays the currency values using the default settings, for example, 123456.78.
The alternate text in the chart and in the values on the Detail View displays the currency in the defined formats.