Working with Analytic Grids
This section discusses how to interact with analytic grids.
Analytic grids are specific to PeopleSoft Analytic Calculation Engine, which is the PeopleSoft multidimensional reporting tool. Within PeopleSoft Analytic Calculation Engine, analytic models define the rules for calculating data. Analytic models consist of data cubes and dimensions. Data cubes are categories of data; you create one for each kind of information in your analytic model; for example, one for sales, one for rent, and one for salary. Dimensions are a list of one kind of data that can span various contexts; for example, months or product codes. You organize data cubes and dimensions into cube collections. Single members of data cubes or dimensions—such as one month—are known as members.
When the analytic grid is in Freeze Column mode, you can load into it data that does not come from the Analytic Calculation Engine.
PeopleSoft Pure Internet Architecture pages containing analytic grids display data from cube collections. You can use the analytic grid to edit data, pivot data cubes and dimensions (you move them between the row and column axis of the grid) to gain a different view of data, and view selected slices of data. Within an analytic grid, you can expand and collapse dimensions with a hierarchical structure; you can also drill down into such dimensions. Finally, you can modify preferences within an analytic grid and then save a particular layout that you have created or return to the default grid layout.
See Analytic Calculation Engine.
Image: Example of analytic grid components
This example illustrates the components of an analytic grid.
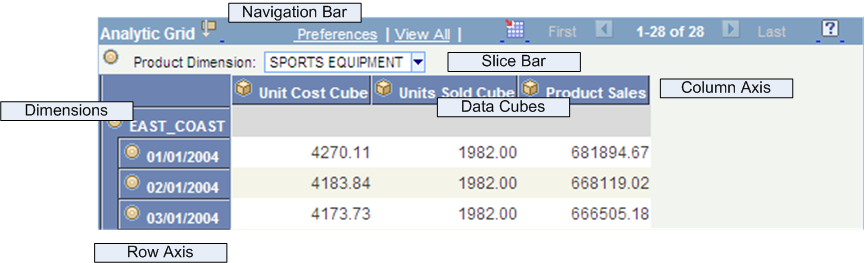
Usually, the navigation bar at the top of an analytic grid is much like the one associated with an ordinary grid.
However, in an analytic grid you can also:
Collapse or expand the slice bar by clicking the arrow to the right of the analytic grid name (the name is Analytic Grid by default), which appears in the upper-left corner of the grid.
Collapse and expand the entire grid if the application developer has activated this feature via the Collapsible Data Area check box on the Use tab of the Analytic Grid Properties dialog box. To do so, you use the arrow to the left of the analytic grid title, which is Analytic Grid by default.
Collapse or expand dimensional data by clicking the expand node or the expand all icons.
Editing data in an analytic grid is somewhat different from editing data in a standard grid:
Some cells are editable, but some cells may be designated as read-only.
Calculated cells are read-only.
In hierarchies (trees), only the lowest level is potentially editable.
The root and total cells are not editable.
You can download the contents of an analytic grid to a Microsoft Excel spreadsheet, much as you download data from a regular grid.
This table describes the ways in which you can drag and drop data within an analytic grid:
|
Location |
Drag-and-Drop Possibilities |
|---|---|
|
Row axis |
You can drag from here to the column axis or the slice bar. |
|
Column axis |
You can drag from here to the row axis or the slice bar. |
|
Slice bar |
You can drag from here to the row or column axis. You cannot, however, drag to rearrange objects within the slice bar. |
|
Dimensions |
You cannot drag to rearrange objects within dimensions, whether they are hierarchical or not. |
|
Data cubes |
You cannot reorder data cubes, either on the column axis or the row axis. |
Note: If an application developer specifies No Drag Drop mode for an analytic grid, you cannot drag or drop any item in the analytic grid. In addition, if Freeze Column Mode is specified, you cannot move frozen columns.
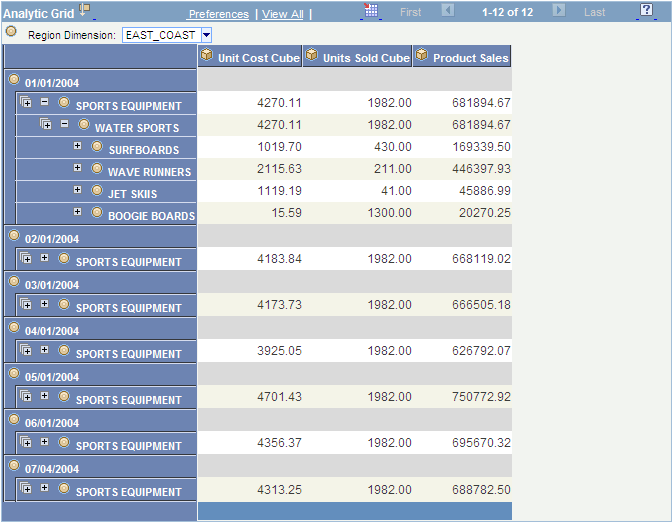
Using drag-and-drop functionality, you can easily change the orientation of data cubes and dimensions within an analytic grid to get a different perspective on your data. For example, if your analytic grid initially displays the Month dimension across the columns and the Products data cube down the rows, you could pivot the report to display the Months dimension down the rows and the Products data cube across the columns.
Adjacent to the navigation elements is an icon that provides help text for novice users to perform drag-and-drop operations successfully. Clicking the icon toggles the appearance of the help text.
Image: Analytic grid with help text displayed before pivot operation
This example illustrates help text for an analytic grid before completing a pivot operation.
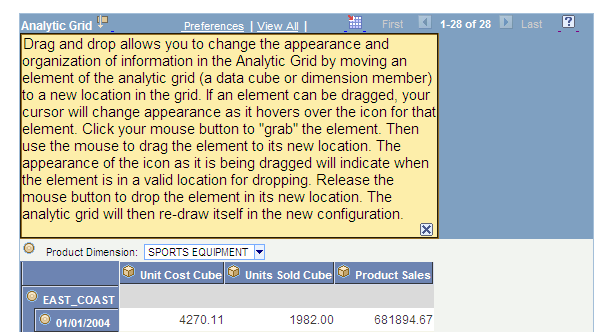
Image: Analytic grid after pivot operation
This example illustrates an analytic grid after completing a pivot operation.
To pivot cubes and dimensions within an analytic grid:
Move the mouse pointer over the bullet icon representing a dimension or the cube icon representing a data cube.
The mouse pointer turns into a move cursor (a four-headed arrow) with an associated grabber hand.
Drag the bullet or cube icon from a column heading to a row heading or vice versa.
As you drag, the grabber hand will turn into an international no sign (circle with a slash) when you are over locations where you cannot drop. You will see a bullet icon (for dimensions) or cube icon (for data cubes) when you drag over locations where you can drop the data cube or dimension.
Note: You can drop data cubes and dimensions onto the row axis, the column axis, and the slicer bar.
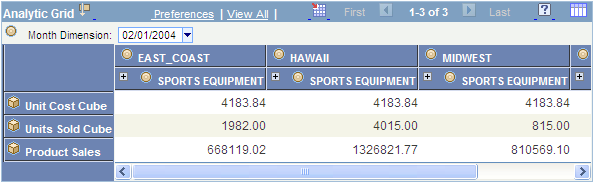
Slicing allows you to view a subset of your data. You can slice your data by choosing from any list—representing data cubes or dimensions—that appears on the slice bar by default. In addition, you can add data cubes or dimensions to the slice bar and use them to view alternate slices of your data. You can place multiple data cubes or dimensions on the slice bar. You can also slice your data further (viewing subsets of subsets) by choosing members from various data cubes and dimensions upon which to slice.
Note: You can add as many data cubes or dimensions to the slice bar as you want. Three fit per row, so if you add more than three, the fourth and so on are added to a second row on the slice bar. However, note that you can place only a single data cube on the slice bar. When you do so, the analytic grid reflects the data for that data cube only.
Image: Slice showing only February data
This example illustrates a slice that shows only February data.
To slice your data based on a data cube or dimension that already appears on the slice bar:
Use the list box on the slice bar to display the values for the relevant data cube or dimension.
For example, a Months dimension would contain a list of months.
Select the desired value from the list box.
The analytic grid changes to show only data related to that value. For instance, if you select the month of March, you will see only data for that particular month.
To add a data cube or dimension to the slice bar and use it to slice your data:
Drag the desired data cube or dimension to the slice bar.
Select a member.
You will now see data related to that member only.
Dimensions that have filter functions applied will behave differently depending on whether they reside on the column axis, row axis, or slice bar.
Some dimension data has a hierarchical structure. When this is the case, you can expand and collapse dimension data within the analytic grid. In addition, you can drill down into the hierarchy to get a closer look at a particular subset of the data.
Image: Collapsed analytic grid with multiple nodes to expand
This example shows a collapsed analytic grid with multiple nodes to expand.
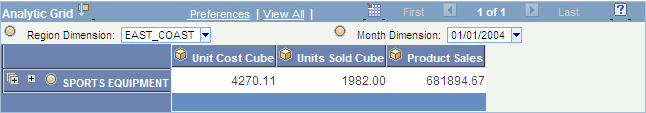
Image: Collapsed analytic grid
This example shows a collapsed analytic grid.
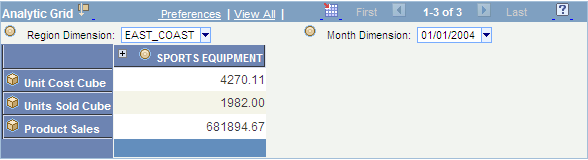
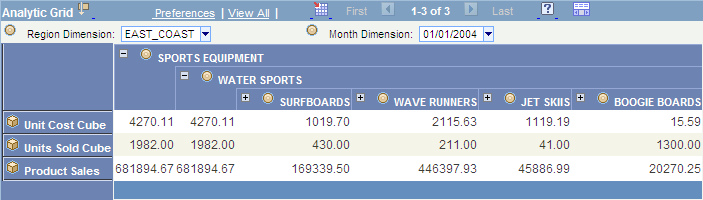
Image: Expanded analytic grid
This example shows an expanded analytic grid.
To expand or collapse dimension data:
Click the plus sign to the left of the dimension name to expand that dimension, showing all subdimensions immediately beneath it.
This approach expands the dimension one level at a time. If you click the multiple plus sign to the left of the single one, then all the dimensions are expanded.
Click the plus sign to the left of any subdimensions to expand them.
Click the minus sign to the left of any dimension to collapse it.
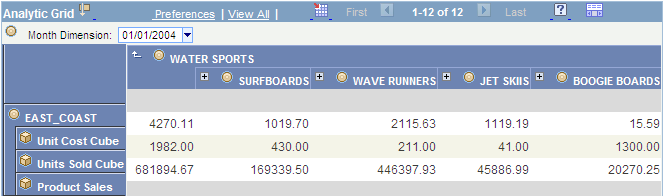
Image: Drilling in to see just the water sports information
This example illustrates drilling in to see just the water sports information.
To drill into and out of dimension data:
Click any dimension or subdimension that has elements beneath it in the hierarchy (it is underlined and has a plus or minus sign to its left).
The plus or minus sign changes to a Drill out this node arrow, and you see only the dimension or subdimension you clicked plus any elements directly beneath it in the hierarchy.
Click the Drill out this node arrow to drill back out within the hierarchy.
The dimension now shows the node that you clicked plus one level above it.
You have learned how to personalize the initial layout of the analytic grid by pivoting data cubes and dimensions, viewing selected slices of your data, and more. In addition, you can save your personalizations and return to them later. If you have saved a personalized layout, you can also easily return the analytic grid to its original settings.
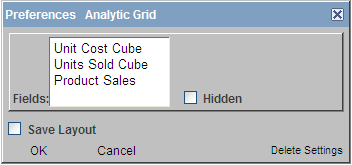
Note: The configuration of the Preferences dialog box changes depending upon whether a cube is in the column header. If a cube is in the header, then you have the option to hide nondimensional fields. If not in the header, then this option is not available.
Image: Preferences dialog box
This example illustrates the fields and controls on the Preferences dialog box.
To save a personalized analytic grid layout:
Modify the grid layout as desired.
Click the Preferences link.
The Preferences dialog box appears.
If applicable, select which nondimensional fields to hide by selecting them and clicking the Hidden check box.
You can hide all nondimensional fields but one. For example, if you have three, you can hide two; if you have four, you can hide three; and so on.
Select the Save Layout check box and click OK.
To restore the default settings of an analytic grid:
Click the Preferences link.
The Preferences dialog box appears.
Click Delete Settings.
Note: Clicking Delete Settings restores the default layout of the analytic grid and also unhides hidden nondimensional fields.