Chart2 - Activities Executed in a Cycle Step
Processing Time (Y-axis) Vs Activities (X-axis)
When a user selects a cycle step from the "Complete Cycle" chart (i.e. Chart 1), Chart 2 will be populated with the distinct activity names executed by the selected cycle step. The cycle step’s name is displayed as its title and will change as the user makes selections on Chart 1. This is a split chart with 2 Y-axis representing total processing time and volume by distinct Activity name on the X-axis i.e.
Y-axis:
- Processing time
- Volume
X-axis:
- Activity name
Width of bar will vary depending on the number of distinct Activity Names and ordered by the most expensive Activity in regards to time processing to least expensive. By default, the left most bar is selected for population of the next chart (i.e. Chart 3).
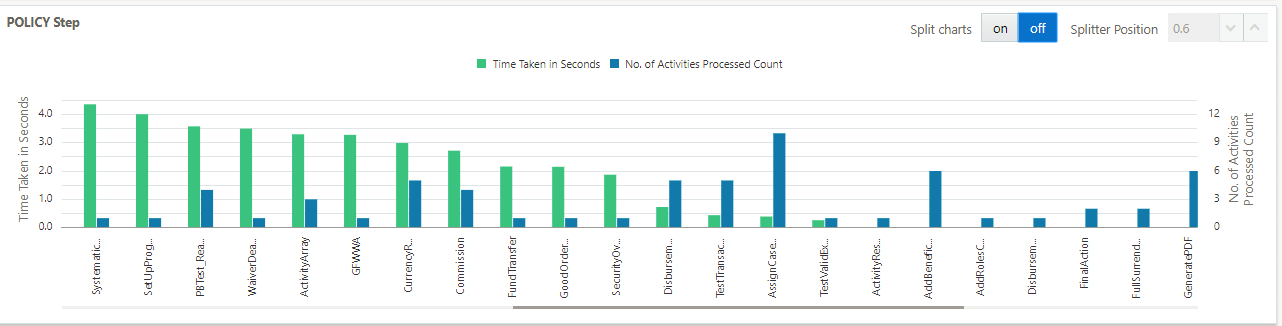
A toggle with "ON" and "OFF" options allows the user to view the graph in two charts labeled by the different Y-axis or combine the two Y-axis in one chart. When the user selects a bar on the chart, the next chart (Chart 3) will be populated with the Activities information.
Chart 2 with Different Y-axis
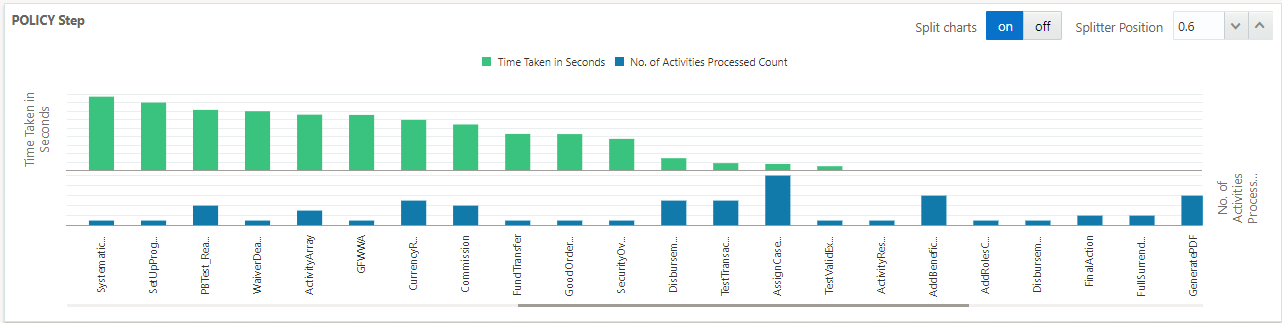
Chart 2 with 2 Y-axis in one chart