Chart3 - The Individual Activities with the Same Name
Processing Time (Y-axis) Vs Policy numbers for Policy cycle step, Client name for Client cycle steps and Activity GUID for Plan and Company cycle steps (X-axis)
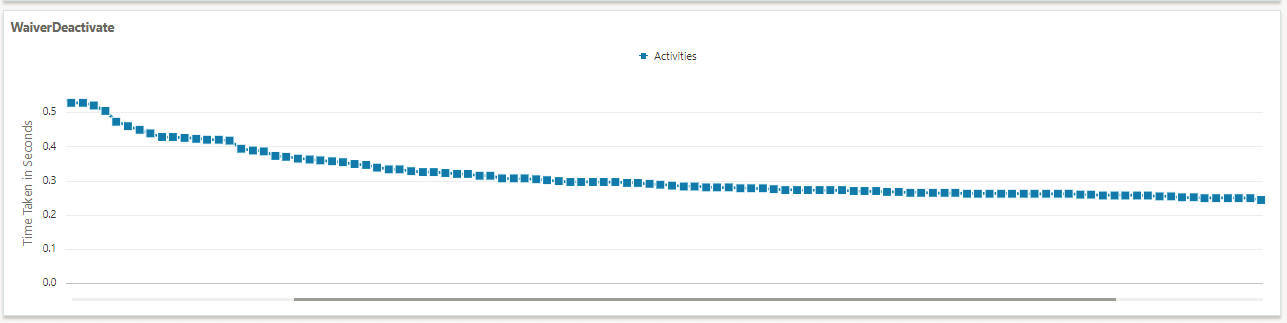
When a user selects an Activity Name from the Chart 2, Chart 3 will be populated with the individual activities of the same activity name from the same cycle step. The selected Activity’s name from Chart 2 is its title and this will change as the user makes selections onChart 2.
This chart presents Processing time in the Y-axis and Policy numbers for Policy cycle step, client name for Client cycle steps and activity guid for Plan and Company cycle steps in the X-axis.
The top line of the chart represents all policies that executed activities with the same name for the given System Date. The X-axis is arranged by the most expensive Policies on the left progressing to the least expensive on the right. The line contains selection points. Each point provides information about the policy and activity represented by that point.

The user can zoom into the data points especially when there are hundreds or thousands of them. The user may select any data point in order to view more detailed information about that Policy's execution of the Activity.