Working with the Connection Status Pane
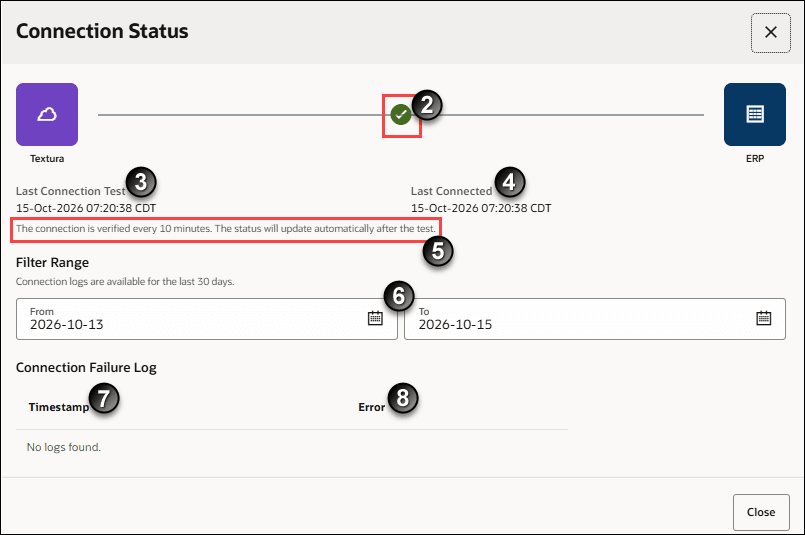
- Current Status (Not Pictured): Shows whether the ERP connection is available. When the connection is down, the related error appears below the status. Record the message exactly when troubleshooting.
- Connection Indicator: Shows the connection from Textura through the adapter service to the ERP. A red indicator means Textura could not communicate with the adapter or the adapter could not connect to the ERP. Use the error message to identify which connection failed.
- Last Connection Test: Shows the date and time of the latest automatic test. It does not indicate that an import or export job ran.
- Last Connected: Shows when Textura last connected successfully to the ERP. The field may be blank if Textura has not recorded a successful connection or the connection is unavailable.
- Automatic Testing Schedule: Textura tests the connection every 10 minutes and updates the status. You cannot start or retry a test manually. After correcting an issue, wait for the next test.
Connection times show the applicable time-zone abbreviation. Include it when reporting an issue.
- Filter Range: Use From and To to select a review period. Logs cover the last 30 days. Selecting earlier dates does not show older records.
- Timestamp: Shows when the failure began and, if available, ended. Present means the connection was still down when Textura retrieved the status.
- Error: Shows the connection error. Textura may group repeated tests with the same error into one failure period. When troubleshooting or contacting support, use the complete current error in the status banner. Hover over a truncated message to see the full text.