Reports in BI Publisher

The upper-case groups (e.g., Performance, QoS, Registrations, etc.) correspond to the canned reports, while the lower-case groups (e.g., radius-stats, session-agent, sip-invites, etc.) correspond to the SBC's HDR groups. For more information about HDR groups, see the HDR Resource Guide for your software version.

Run a Canned Report

Report Manager comes with the following predefined reports:
  • Dashboard—Displays space used, fan speed, temperature, and voltage.
  • Performance—Displays CPU, memory, registration cache, and concurrent sessions.
  • QoS—Displays RFactor, major exceeded, critical exceeded, and successful sessions.
  • Registrations—Displays total registrations, initial registrations, refresh registrations, and de-registrations.
  • Security—Displays ACL entries, requests and message status, ACL entry promotions and demotions, and demotions.
  • Session Realm—Displays calls per second, QoS RFactor, answer seizure ratio, and one-way signalling latency.
  • Summary—Displays sessions, session state, dialogs, and errors.
  1. In the toolbar, click Catalog.
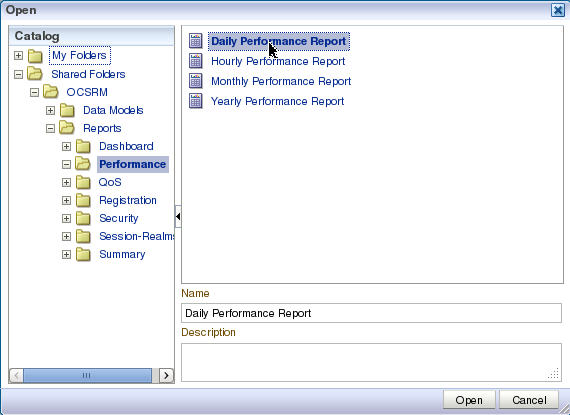
  2. In the Folders section, navigate to Shared Folders, OCSRM, Reports.
  3. Select one of the following folders:
    • Dashboard
    • Performance
    • QoS
    • Registrations
    • Security
    • Session Realm
    • Summary
  4. To run the report, select Open under the time granularity you want (Daily, Hourly, Monthly, Yearly).

    Note:

    If hourly summary reports are not displaying, see "Hourly Summary Reports" in Report Manager Installation Guide for Oracle Fusion Middleware 12c.
  5. To schedule a report, click Schedule.
  6. To manage the job or edit start and end times, click Jobs.
  7. To view the job history, click Job History.
  8. To add the report to your Favorites, click More, Add to Favorites.

Create a Data Model

Use this task to create a data model that is later used for a BI Publisher Oracle Communications Session Delivery Manager Report.

Note:

See the BIP product page for more options for creating data models.
  1. Login to Oracle Communications Session Delivery Manager as a reporting user and select Report Manager, Operational Reports.

    Note:

    You must be logged in as a reporting user to view the Operational Reports selection under the Report Manager. Refer to the Apply User Group Privileges for Applications section for more information.
    A new browser tab displays the BI Publisher Enterprise page.
  2. On the BI Publisher Enterprise login page, enter the user name and password credentials.
  3. On the BI Publisher Enterprise page, select Create, Data Model to create a new data model.
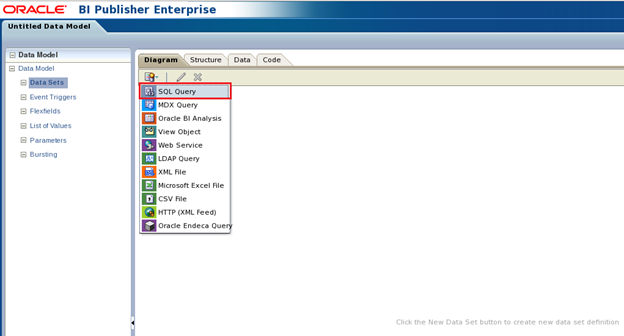
  4. In the Data Model navigation pane, select Data Model, Data Sets and select SQL Query from the Diagram tab.
    Refer to the preceding text for a description of this figure.
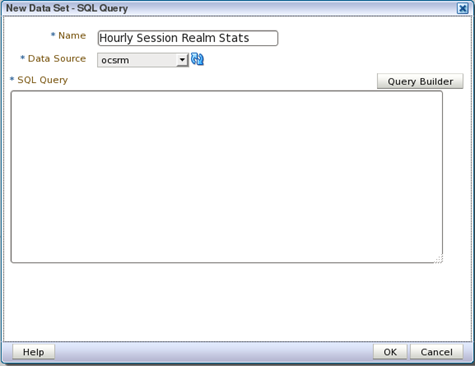
  5. In the New Data Set - SQL Query dialog box, complete the following fields:
  6. Next, in the New Data Set - SQL Query dialog box, click Query Builder to build your SQL query. For example:
    Refer to the preceding text for a description of this figure.
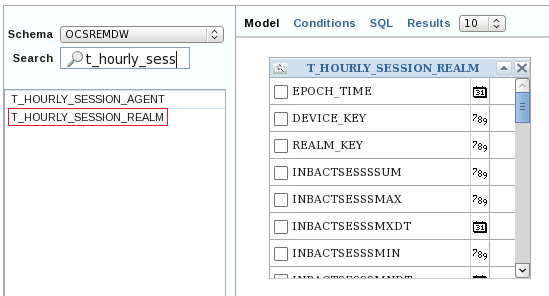
  7. In the query builder tool (refer to the illustration in step 8), select OCSREMDW from the Schema drop-down list, which is the Oracle database schema that contains the tables that contains the HDR raw and aggregated data sets for the device.
  8. In the Search field, enter the table name for which you are searching. In the example below, a table prefixed T_HOURLY_* indicates that the data is aggregated in hourly increments, a table prefixed T_DAILY_* indicates that the data is aggregated in daily increments, and so on.
    Refer to the preceding text for a description of this figure.
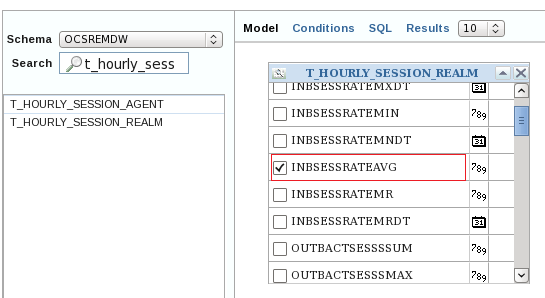
  9. Scroll through the selected table columns and check the desired boxes for the data set. For example:
    Refer to the preceding text for a description of this figure.
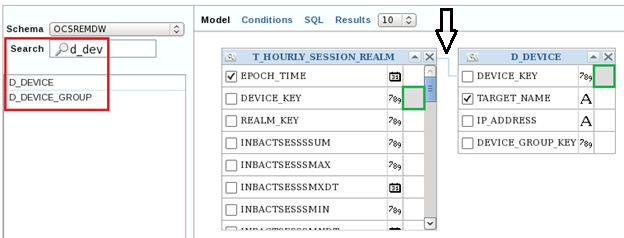
  10. In the Search field, enter the D_DEVICE table.
  11. Join the two tables that appear by matching the DEVICE_KEY (primary key) row from both tables by clicking on the grey box to the right of the DEVICE_KEY row in each table. The black arrow shows a blue line joining the two tables after they are they are connected successfully. For example:
    Refer to the preceding text for a description of this figure.
  12. In the Search field, enter the D_REALM table.
  13. Join the two tables that appear by matching the REALM_KEY (primary key) row from both tables by clicking on the grey box to the right of the REALM_KEY row in each table. The blue line joins the two tables after they are they are connected successfully. For example:
    Refer to the preceding text for a description of this figure.
  14. Check all the check boxes with the desired data columns.
  15. Click Save to exit the query builder tool.
  16. In the New Data Set - SQL Query dialog box, click OK.
    A data model is successfully created.

Create a Filter for a Session Delivery Manager Report: Example

The following example is used to create a filter with a device group, list of values, and device parameters for an Oracle Communications Session Delivery Manager report. The filter name is displayed as a drop-down list item in the report using the data model you added in the previous section.

Note:

The SQL queries must be entered exactly as they are shown in the following steps if you are going to use this example.
  1. In the Data Model navigation pane, click List of Values.
  2. In the List of Values pane, click the plus (+) icon above the table to create a new list of values in the table.
  3. In the new table row under the Name column, enter the name devices.

    Note:

    Ensure that the Type drop-down list is set to SQL Query and the Data Source drop-down list is set to ocsrm for this step and subsequent steps.
  4. In the SQL query box below the table, enter the following SQL query:
    select	 d_device.target_name as target_name
     from	ocsremdw.d_device_group d_device_group,
    	ocsremdw.d_device d_device 
     where   d_device.device_group_key=d_device_group.device_group_key and device_group_name in ( :device_group)
    
  5. In the List of Values pane, click the plus (+) icon again to create another list of values in the table.
  6. In the next table row under the Name column, enter the name realms.
  7. In the SQL query box below the table, enter the following SQL query:
    select d_realm.realm_name as realm_name 
     from ocsremdw.d_realm d_realm
    
  8. In the List of Values pane, click the plus (+) icon again to create another list of values in the table.
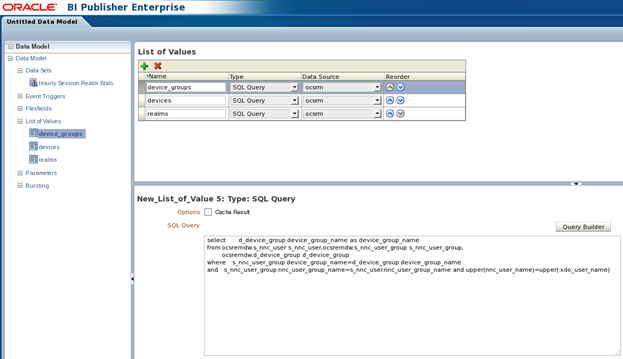
  9. In the next table row under the Name column, enter the name device_groups.
  10. In the SQL query box below the table, enter the following SQL query:
    select	d_device_group.device_group_name as device_group_name 
     from	ocsremdw.s_nnc_user s_nnc_user,ocsremdw.s_nnc_user_group s_nnc_user_group,
    	ocsremdw.d_device_group d_device_group 
     where   s_nnc_user_group.device_group_name=d_device_group.device_group_name
     and	 s_nnc_user_group.nnc_user_group_name=s_nnc_user.nnc_user_group_name and upper(nnc_user_name)=upper(:xdo_user_name)
    
    Once the list of values for devices, realms, and device groups is configured, the List of Values pane appears. For example:
    Refer to the preceding text for a description of this figure.
  11. In the Data Model navigation pane, click Parameters.
  12. In the Parameters pane, click the plus (+) icon above the table to create a parameter in the table.
  13. In the new table row under the Name column, enter the name device_group, select Menu from the Parameter Type drop-down list and complete the following fields:
  14. In the Parameters pane, click the plus (+) icon above the table to create a parameter in the table.
  15. In the new table row under the Name column, enter the name start_date, select Date from the Data Type drop-down list, select Date from the Parameter Type drop-down list, select 2 from the Row Placement drop-down list and complete the following fields:
  16. In the Parameters pane, click the plus (+) icon above the table to create a parameter in the table.
  17. In the new table row under the Name column, enter the name end_date, select Date from the Data Type drop-down list, select Date from the Parameter Type drop-down list, select 2 from the Row Placement drop-down list and complete the following fields:
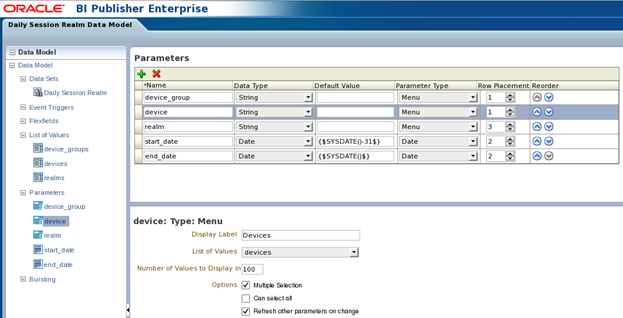
    Once the list of parameter values is configured, the Parameters pane should appear as shown below:
    Refer to the preceding text for a description of this figure.
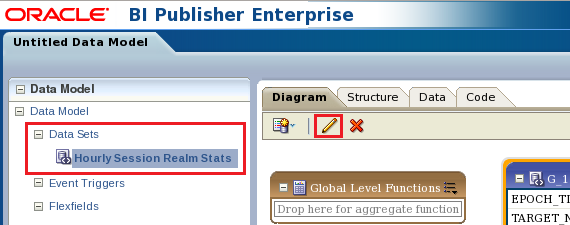
  18. In the Data Model navigation pane, select Data Sets > Hourly Session Realm Stats as shown in the Untitled Data Model window below:
    Refer to the preceding text for a description of this figure.
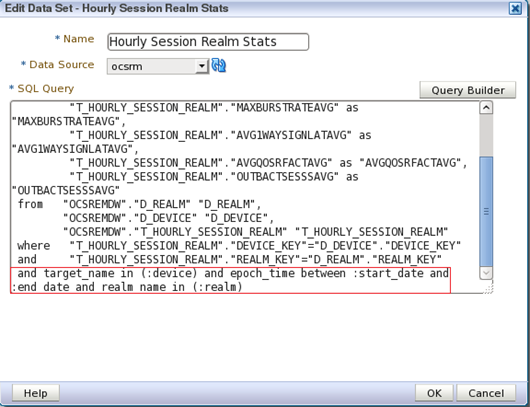
  19. In the pre-populated Edit Data Set - Hourly Session Realm Stats dialog box, enter the text shown in the red box in the figure below after the existing text in the SQL Query box:
    Refer to the preceding text for a description of this figure.
    The line you entered joins the parameters that you created in the previous stems and filters the resulting query based on the devices, realms, start, and end dates selected in the report.
  20. Click OK.
  21. In the Untitled Data Model screen, click the save (disk) icon on the top right side of the window and save the data model. For example, you can name it "Hourly Session Realm Stats Data Model."
  22. After you successfully save the data model, you can create a report called "Daily Session Realm Stats Report" using this newly created "Hourly Session Realm Stats Data Model."

Create a New Report

  1. In the Create section, click Report.
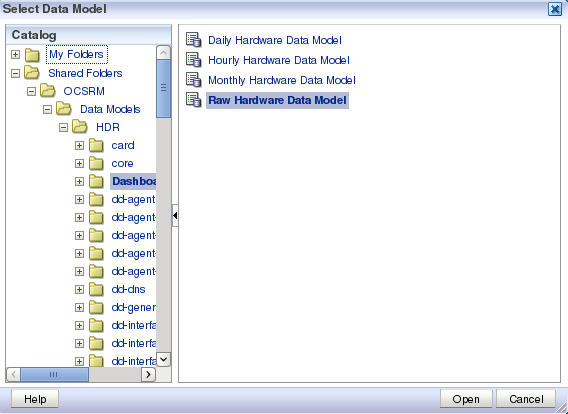
  2. If your data source is an existing data model, select Use Data Model, click the magnifying glass, and select an existing data model from the catalog. If your data source is in a spreadsheet, click Upload Spreadsheet and browse to the .xls file.
    If the uploaded spreadsheet contains multiple sheets, select the sheet to use as the data source. You can include data from only one sheet.

    A picture of selecting a data model from the catalog is shown.

    Refer to the preceding text for a description of this figure.
  3. After selecting a data model, click Open.
  4. Click Next.
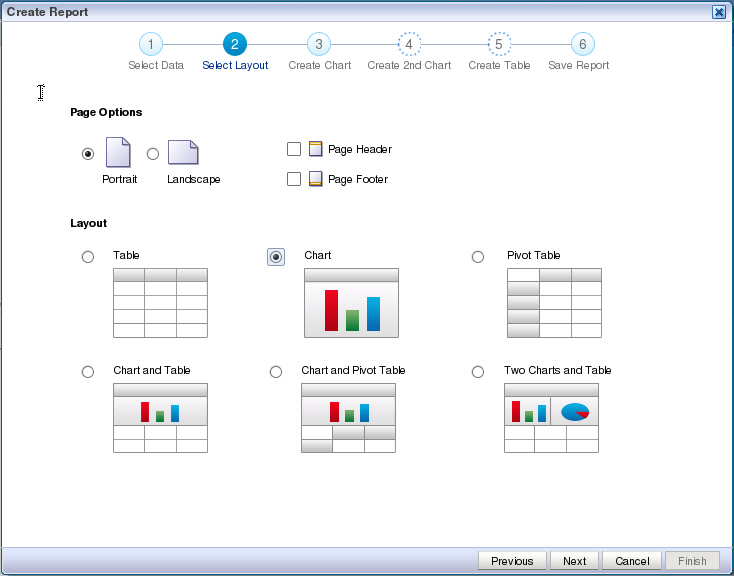
  5. Select a layout for your report.
    Page Options are:
    • Portrait
    • Landscape
    • Page Header
    • Page Footer
    Layout options are:
    • Table
    • Chart
    • Pivot Table
    • Chart and Table
    • Chart and Pivot Table
    • Two Charts and Table

    Refer to the preceding text for a description of this figure.

  6. Click Next.
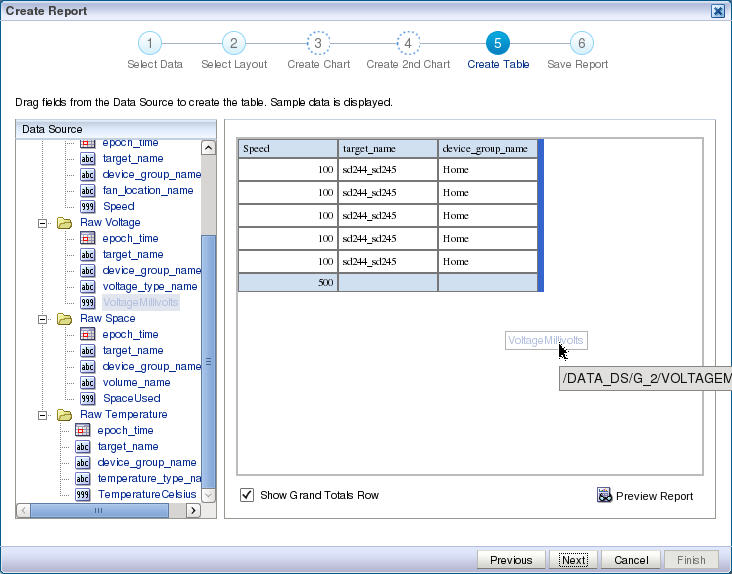
  7. Select the parameters you want in your table and drag them from the Data Source tree to the main window.
    Refer to the preceding text for a description of this figure.
  8. Select View Report and click Finish.
  9. In the Save As dialog box, select a location to save the report and a title.
  10. Click Save.
  11. The report will begin automatically.

    Note:

    For more information about running reports, see Creating and Editing Reports from the BI Publisher documentation.

Schedule a Report in BI Publisher

  1. From the Report Manager slider, click Operational Reports.
  2. On the BI Publisher Enterprise login page, enter the user name and password credentials.
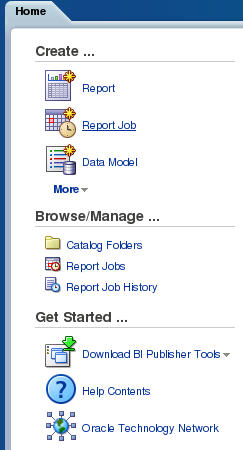
  3. Click Report Job in the Create section of the Home tab.
    Refer to the preceding text for a description of this figure.
  4. Click the magnifying glass icon next to the Report field to select a report.
    Refer to the preceding text for a description of this figure.
  5. Expand Shared Folders, OCSRM, Reports.
  6. Select the canned report you want. Then select the time granularity you want.
    The figure shows the selection of a canned report.
  7. Click Open.
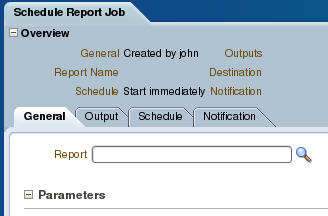
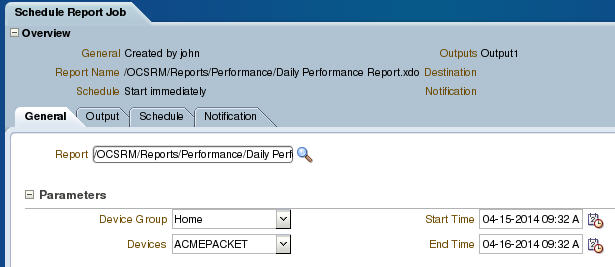
  8. In the Schedule Report Job tab, click the calendar icon next to the Start Time field to specify the start time and click the calendar icon next to the End Time field to specify the end time for the report.
    Refer to the preceding text for a description of this figure.
  9. Click Submit in the top right corner.