OXI Central Monitor (Detailed Statistics)
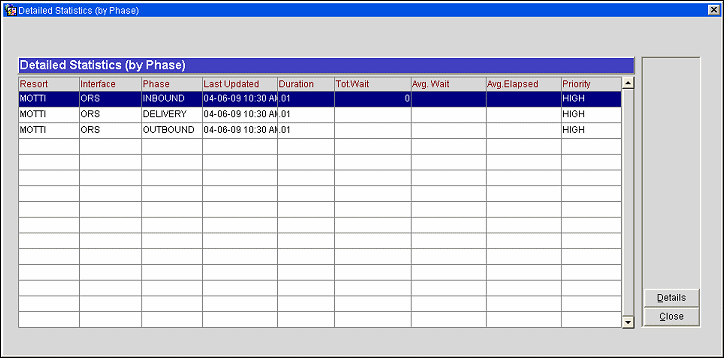
When the Details button is selected on the OXI Central Monitor screen, the Detailed Statistics (by Phase) screen displays statistics relative to the interface/resort selected on in the Statistics Summary grid of the Central Monitor.

Resort. Displays the Resort Name.
Interface. Displays the Interface ID.
Phase. Displays the phase of activity for the interface (e.g., INBOUND, OUTBOUND, DELIVERY, etc.).
Last Updated. Displays a date and time stamp indicating the last time this record was updated.
Duration. Displays the duration (in days) of the snapshot.
Tot. Wait. Sum of the wait time for each message processed in the snapshot time frame, displayed in seconds.
Avg. Wait. Average wait time of all messages processed in the snapshot time frame, displayed in seconds.
Avg. Elapsed. Average processing time of all messages in the snapshot time frame, displayed in seconds.
Priority. Displays the priority of the message group, for example, resync business events are a low priority.
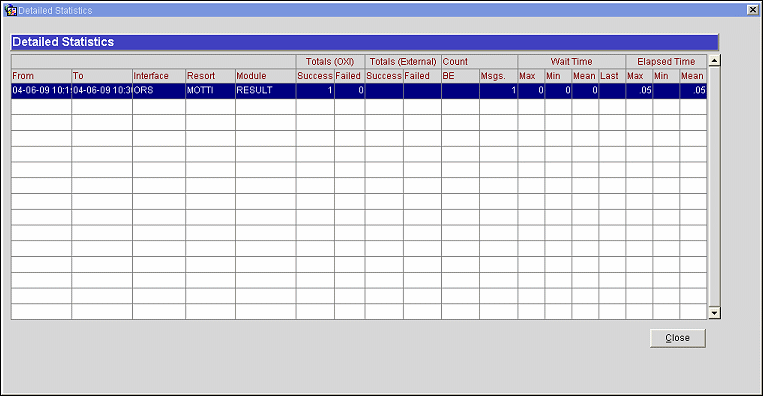
When the Details button on the Detailed Statistics (by Phase) screen is selected, this screen provides an in-depth view of the selected or highlighted record on the previous screen.

From/To. These fields display the begin time and end time that statistical data was collected for this snapshot, typically fifteen minutes.
Interface. Displays the associated Interface ID.
Resort. Displays the associated Resort.
Module. Displays the affected Module name.
Totals (OXI)
Success. Displays the total count of successful messages in OXI.
Failed. Displays the total count of failed messages in OXI.
Totals (External)
Success. Displays the total count of successful messages in the external system (RESULT SUCCESS).
Failed. Displays the total count of failed messages in the external system (RESULT FAILED).
Count
BE. Displays the number of business events processed.
Msgs. Displays the number of messages processed.
Wait Time
Max. The maximum amount of time a message waited before being processed.
Min. The least amount of time a message waited before being processed.
Mean. The average amount of time a message waited before being processed.
Last. The total amount of time the last message waited before being processed.
Elapsed Time
Max. The maximum amount of time a message spent processing
Min. The least amount of time a message spent processing.
Mean. The average amount of time a message spent processing.
See Also