7Execute Performance Tests
Execute Performance Tests
This chapter describes the process of executing performance tests. It includes the following topics:
Overview of Executing Performance Tests
As described earlier, there are three types of performance test cases that are typically executed: response time, stress, and reliability testing. It is important to differentiate between the three because they are intended to measure different KPIs (key performance indicators). Specialized members of the testing and system administration organizations, who have ownership of the system architecture and infrastructure, typically manage performance tests.
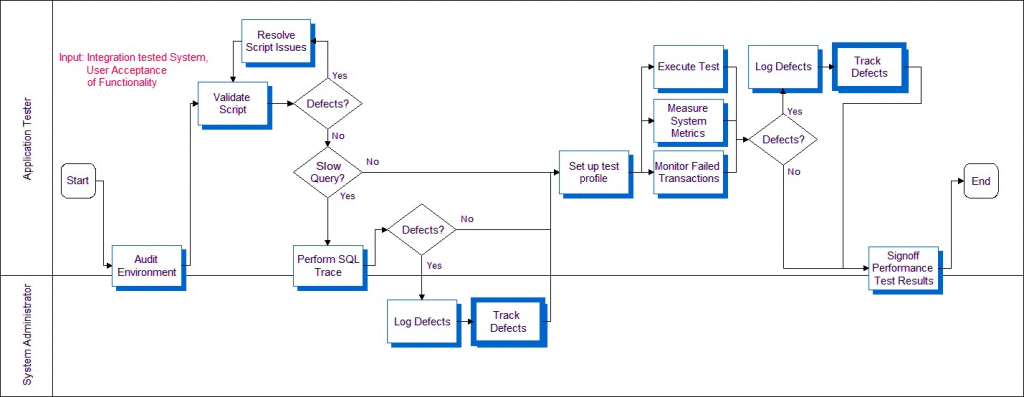
The following illustrates the process for performance test execution. The first step involves validating recorded user-type scripts in the system test environment.
Executing Tests
Execute each script for a single user to validate the health of the environment. A low user-load baseline should be obtained before attempting the target user load. This baseline allows you to measure system scalability by comparing results between the baseline and target loads.
Users must be started at a controlled rate to prevent excessive resource utilization due to large numbers of simultaneous logins. This rate depends on the total configured capacity of the system. For every 1000 users of configured system capacity, you add one user every three seconds. For example, if the system is configured for 5000 users, you add five users every three seconds.
Excessive login rate causes the application server tier to consume 100% CPU, and logins begin to fail. Wait times should be randomized during load testing to prevent inaccuracies due to simulated users executing transactions simultaneously. Randomization ranges should be set based on determining the relative wait times of expert and new users when compared to the average wait times in the script.
Performing an SQL Trace
Because poorly formed SQL or suboptimal database-tuning causes many performance issues, the first step to improve performance is to perform an SQL trace. An SQL trace creates a log file that records the statements generated in the Siebel object manager and executed on the database. The time required to execute and fetch on an SQL statement has a significant impact on both the response time seen by end users of a system, and on the system’s resource utilization on the database tier. It is important to discover slow SQL statements and root cause, and fix issues before attempting scalability or load tests, as excessive resource utilization on the database server will invalidate the results of the test or cause it to fail.
To obtain an SQL trace
Set a breakpoint in the script at the end of each action and execute the script for two iterations.
Enable EvtLogLvl (ObjMgrSqlLog=5) to obtain SQL traces for the component on the application server that has this user session or task running.
Continue executing the script for the third iteration and wait for the breakpoint at the end of action.
Turn off SQL tracing on the application server (reset it to its original value, or 1).
Complete the script execution.
The log file resulting from this procedure has current SQL traces for this business scenario. Typically, any SQL statement longer than 0.1 seconds is considered suspect and must be investigated, either by optimizing the execution of the query (typically by creating an index on the database) or by altering the application to change the query.
Measuring System Metrics
Results collection should occur during a measurement period while the system is at a steady state, simulating ongoing operation in the course of a business day. Steady state is achieved once all users are logged in and caches (including simulated client-side caches) are primed. The measurement interval should commence after the last user has logged in and completed the first iteration of the business scenario.
The measurement interval should last at least one hour, during which system statistics should be collected across all server tiers. We recommend that you measure the following statistics:
CPU
Memory
System calls
Context switches
Paging rates
I/O waits (on the database server)
Transaction response times as reported by the load testing tool
The analysis of the statistics starts by identifying transactions with unacceptable response times, and then correlating them to observed numbers for CPU, memory, I/O, and so on. This analysis provides insight into the performance bottleneck.
Monitoring Failed Transactions
Less than 1% of transactions should fail during the measurement interval. A failure rate greater than 1% indicates a problem with the scripts or the environment.
Typically, transactions fail for one of the following three reasons:
Timeout. A transaction may fail after waiting for a response for a specified timeout interval. A resource issue at a server tier, or a long-running query or script in the application can cause a timeout.
If a long-running query or script is applicable to all users of a business scenario, it should be caught in the SQL tracing step. If SQL tracing has been performed, and the problem is only seen during loaded testing, it is often caused by data specific to a particular user or item in the test database. For example, a calendar view might be slow for a particular user because prior load testing might have created thousands of activities for that user on a specific day. This would only show as a slow query and a failed transaction during load testing when that user picks that day as part of their usage scenario
Long-running transactions under load can also be caused by consumption of all available resources on some server tier. In this case, transaction response times typically stay reasonable until utilization of the critical resource closely approaches 100%. As utilization approaches 100%, response times begin to increase sharply and transactions start to fail. Most often, this consumption of resources is due to the CPU or memory on the Web server, application server, or database server, I/O bandwidth on the database server, or network bandwidth. Resource utilization across the server tiers should be closely monitored during testing, primarily for data gathering purposes, but also for diagnosing the resource consumption problem.
Very often, a long-running query or script can cause consumption of all available resources at the database server or application server tier, which then causes response times to increase and transactions to time out. While a timeout problem may initially appear to be resource starvation, it is possible that the root cause of the starvation is a long-running query or script.
Data issues. In the same way that an issue specific to a particular data item may cause a timeout due to a long-running query or script, a data issue may also cause a transaction to fail. For example, a script that randomly picks a quote associated with an opportunity will fail for opportunities that do not have any associated quotes. You must fix data if error rates are significant, but a small number of failures do not generally affect results significantly.
Script issues. Defects in scripts can cause transaction failures. Common pitfalls in script recording include the following:
Inability to parse Web server responses due to special characters (quotes, control characters, and so on) embedded in data fields for specific records.
Required fields not being parameterized or handled dynamically
Strings in data fields that are interpreted by script error-checking code as indicating a failed transaction. For example, it is common for a technical support database to contain problem descriptions that include the string. The server is down or experiencing problems