| Oracle® Retail Science Cloud Services User Guide Release 18.0.002 F17712-02 |
|

 Previous |
 Next |
This chapter describes the use of the Customer Decision Tree Science Cloud Service module.
A customer decision tree is a decision support tool that uses a tree-like graph to model a customer hierarchical decision-making process for a specific product. The branches of the tree provide a visual representation of the choices a customer makes and the order of importance of various product characteristics. Transaction data is used in the analysis.
A customer decision tree identifies the decisions a customer makes when choosing a particular product. The decision tree is produced by algorithms that analyze historical customer sales data. It illustrates how customers shop and how they evaluate the importance of different product attributes when making buying decisions. Such information can be useful to a retailer in terms of product selection and display.
The CDT Cloud Service module consists of three tabs: Overview, Generate CDTs, and Manage CDTs. You use the Overview tab to keep track of the status of each stage within the Generate CDTs tab. You use the Manage CDTs tab to assess the set of CDTs you and other users have created using the Generate CDTs tab, setting versions as complete, approving versions, and deleting versions, as necessary.
When you use the CDT Cloud Service module, you follow this general iterative process to create and manage CDTs:
Setup. You define the domain of calculation by selecting the categories and time frame for the calculation of the CDTs.
Data Filtering. You configure filters that remove input data that might cause errors in the calculation or that might lead to inaccurate or unreliable answers.
Calculation. You calculate a specific version of a CDT. Different versions of the CDT based on different configurations can be calculated and compared.
Evaluation. You examine the results of the calculation and determine the reliability and accuracy of the answers. You can prune inaccurate or unreliable results.
Escalation. When you are satisfied with the results, you can set the escalation path to fill in the holes for partitions whose CDTs were removed during pruning by setting up a search path through the segment hierarchy and the location hierarchy. Then, you can set a version of a CDT as complete.
Within each stage, you set the required parameters. In some stages, once you do that you click Run to initiate the process. To determine when a run is complete, go to the Overview tab and click the Refresh icon in order to see the current status of each stage. If you make changes to a stage, you must re-run that stage and all the relevant stages that follow it as the results of those stages are made invalid by the changes you made.
The Overview tab displays information that you can view and use to monitor the progress of the CDT stages as well as to view some aggregate statistics and the CDT results from the last successful run.
This tab contains the following sections:
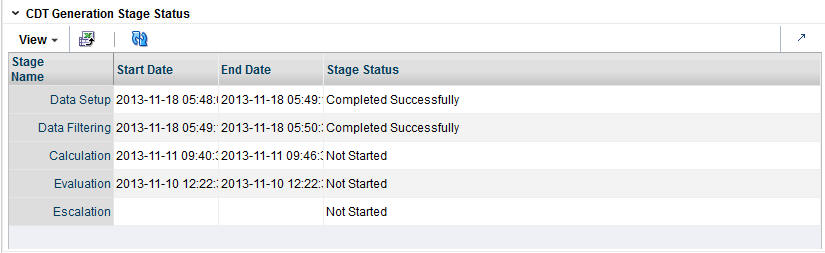
CDT Generation Stage Status
Aggregate Statistics
CDT Calculation Report
CDT Score Distribution
The CDT Generation Stage Status table displays the status of each of the CDT stages.
Click the Refresh icon to update the fields and see the latest status for each stage.
In cases where the status is either Failed or Stopped/Paused, or the run never completes, you should consult the database logs in RSE_LOG_MSG as well as the WebLogic console logs in your WebLogic domain in order to troubleshoot the problem.
You can use the status information to monitor the progress of each stage. It contains the following fields, which can be arranged and viewed, but not modified.
Table 2-1 CDT Generation Stage Status Fields
| Field Name | Description |
|---|---|
|
Stage Name |
A row exists in the table for each CDT stage that provides detailed status information. The five stages are Setup, Data Filtering, Calculation, Evaluation, and Escalation. |
|
Start Date |
The date and time when a run for the stage most recently started. |
|
End Date |
The date and time when a run for the stage most recently ended. |
|
Stage Status |
The current status of the stage: Not Started, Not Started (Scheduled for Later), Processing, Completed Successfully, Completed with Errors, Stopped/Paused, Cancelled, or Failed. |
The following provides an explanation of the different values for the status of a stage.
Table 2-2 Status Explanations
| Stage Status | Description |
|---|---|
|
Not Started |
This indicates that the stage has not yet been initiated. This can occur when you first begin to create a CDT or when you update an existing version. |
|
Not Started (Scheduled for Later) |
The stage is scheduled to start after the previous stage is complete. |
|
Processing |
This indicates that the stage is currently being processed. |
|
Stopped/Paused |
This indicates either that the stage has been stopped by the application or that the user has chosen to stop the process (for example, to make a change to an option). In the later case, once any background processing has stopped, the user can re-run the stopped stage. |
|
Completed Successfully |
This indicates that the stage has been successfully processed. |
|
Completed with Errors |
This indicates that the stage was able to complete the processing of all requested CDTs, but one or more CDTs encountered errors during the run and were not able to complete successfully. This most commonly occurs when the data used for a CDT is not available or is too sparse to produce a result. |
|
Failed |
This indicates that a problem occurred during the processing. If the failure occurred during the Calculation stage, and only a few CDT results did not produce a CDT score, then the user can continue without those results since pruning will remove them. If the failure occurred during any of the other stages, the user must re-run the stage. |
|
Cancelled |
This indicates that the database has cancelled the execution of the stage either because of missing data or an exception. The user should review the RSE_LOG_MSG log to determine the problem. |
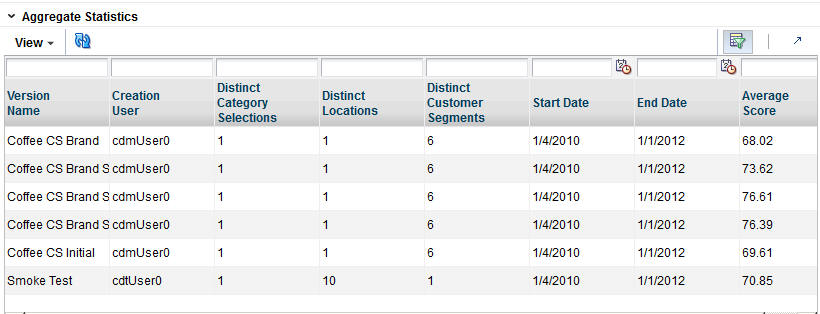
The Aggregate Statistics table displays statistical details about the existing CDT versions.
Click the Refresh icon to update the fields and see the latest information in this table.
Each existing version has a row in the table. The table contains the following fields, which can be arranged and viewed, but not modified.
Table 2-3 Aggregate Statistics Fields
| Field Name | Description |
|---|---|
|
Version Name |
User-created name that identifies this CDT version. The name must be unique to the user. |
|
Creation User |
The login name of the person who created this version. |
|
Distinct Category Selections |
The number of categories associated with this version. |
|
Distinct Locations |
The number of locations associated with this version. |
|
Distinct Customer Segments |
The number of customer segments associated with this version. |
|
Start Date |
The beginning date associated with the CDTs in this version. |
|
End Date |
The end date associated with the CDTs in this version. |
|
Average Score |
The average of the CDT scores for a version. A CDT score ranges from 0 to 100. A higher value indicates a better score. |
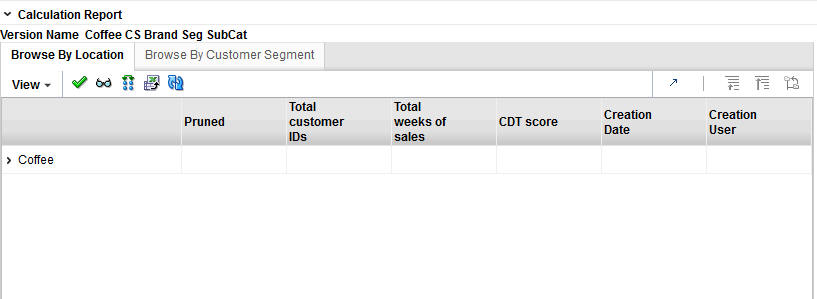
The Calculation Report displays the CDT results for the indicated version from the last successful run, if one has occurred.
Here you can review information by Location or by Customer Segment. You can also set a version as complete, view and edit a CDT, or compare two CDTs.
Click the Refresh icon to update the fields and see the latest information in this table.
The Calculation Report contains the following fields:
Table 2-4 Calculation Report Fields
| Field Name | Description |
|---|---|
|
Partition |
A partition is the combination of category, segment, and location. The column identifies the names of all nodes in the tree structure in the table. The node type may be either category, location, or customer segment. |
|
Pruned |
The number of CDTs removed from the list of usable CDTs. CDTs are removed that do not meet the filtering thresholds. During the Escalation stage, the escalation process makes adjustments for the CDTs that are removed. |
|
Total Customer IDs |
The number of customers used in the calculation of the CDT. |
|
Total Weeks of Sales |
The total number of weeks of sales used in the calculation of the CDT. This provides an indication of the amount of sales data used in the calculation. All the CDTs in a given version should have a similar value; if this is not the case, the results should be evaluated. |
|
CDT Score |
A confidence score assigned to help in assessing the quality of the CDT. A CDT score ranges from 0 to 100. A higher value indicates a better score. |
|
Creation Date |
The date when the version whose data is displayed was created. |
|
Creation User |
The login name of the user who created the version. |
The following icons are available for the Calculation Report:
Set Version as Complete
Each partition must have an active CDT. The active CDT is used by other applications that require a CDT.
All CDTs within a version are activated when you click Set Version as Complete.
If a CDT exists in more than one version, then the most recently activated version takes precedence.
If a version contains multiple categories and is Complete and then a different version with a partial overlap of categories is later marked as Complete, only the overlapping categories are replaced in the new version.
If a version is overwritten, then the CDTs in that version are no longer active.
When a CDT is at risk of going from active to inactive, you will see a warning message.
To determine whether or not a CDT is active, go to the Manage CDTs tab. The Browse by Categories or by Versions table displays a flag that indicates whether or not a CDT is active.
View One CDT
This icon provides access to the CDT Editor. For details about this functionality, see Using the CDT Editor.
Compare Two CDTs
This icon provides access to CDT Compare. For details about this functionality, see Comparing Two CDTs
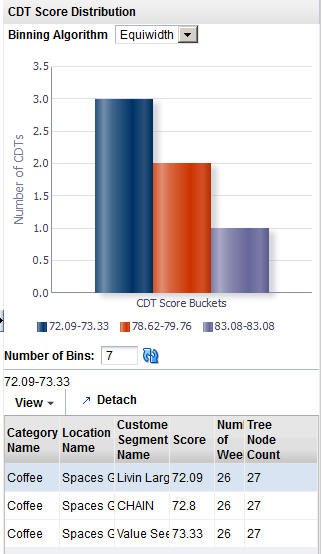
The CDT Score Distribution histogram displays, for the current calculation and the current user, the range of CDT scores and their frequencies. CDT scores range from 0 to 100; a higher number indicates a better score. You can use the information in this histogram to assess the quality of your CDTs.
For detailed information about using the histograms, see Chapter 1, "Getting Started.".
Below the histogram you see a table that provides details about the histogram. This information can help you assess the quality of a CDT. Click on a specific bin in the histogram to populate the table with information about that bin. You see a list of all the specific partitions for the bin, along with the score for each, the number of weeks of data used to calculate the score, and the number of tree nodes for each partition for the selected bin.
Table 2-5 CDT Score Distribution Fields
| Field Name | Description |
|---|---|
|
Category Name |
The category name of the partition for the specific CDT score. |
|
Location Name |
The location name of the partition for the specific CDT score. |
|
Customer Segment Name |
The customer segment name of the partition for the specific CDT score. |
|
Score |
The CDT score for the defined partition. A CDT score ranges from 0 to 100. A higher value indicates a better score. |
|
Number of Weeks |
The number of weeks of data used to calculate the CDT score. |
|
Tree Node Count |
The number of tree nodes present in the CDT tree structure used to calculate the CDT score. |
The Generate CDTs tab is used to configure, run, evaluate, modify, and deploy a CDT. The process is divided into five stages that must be run in order. You can return to a stage you have already completed and make changes, but if you do, you must rerun that stage and all the stages that follow that stage, as the calculations are invalidated by the modifications you just made to the settings in the stage you changed.
To monitor the progress of any stage, go to the Overview tab and click the Refresh icon.
The five CDT stages are:
Table 2-6 Generate CDTs Tab: Stages
| Stage Name | Description |
|---|---|
|
Data Setup |
Select CMPO groups and define the time intervals for the data to be used in the calculation. |
|
Data Filtering |
Filter out input data that may result in inaccurate or unreliable answers. |
|
Calculation |
Calculate the CDT. |
|
Evaluation |
Assess the reliability and accuracy of the results of the calculation. Prune unreliable or inaccurate answers. |
|
Escalation |
Set the escalation path for the CDT. Use the Escalation Report to evaluate the results of the escalation. |
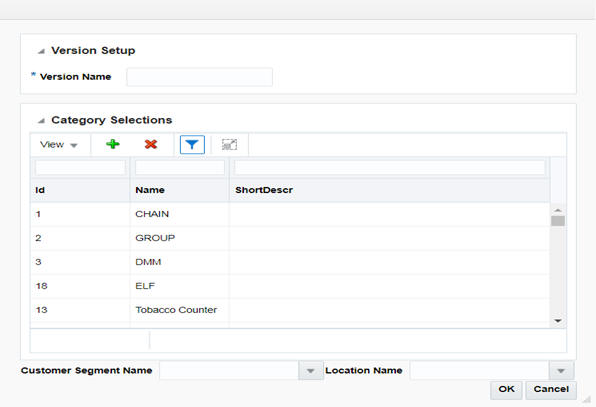
The Data Setup stage provides two sections to configure: Category Selections and Time Interval Setup. In this stage, you select the category or categories you want to calculate CDTs for and specify the time interval for the calculation.
Process
Here is the high-level process for setting up the data for CDT.
Select the category or categories you want to calculate CDTs for.
Set up the time intervals for the CDT calculation.
Click Next to go to the Data Filtering stage.
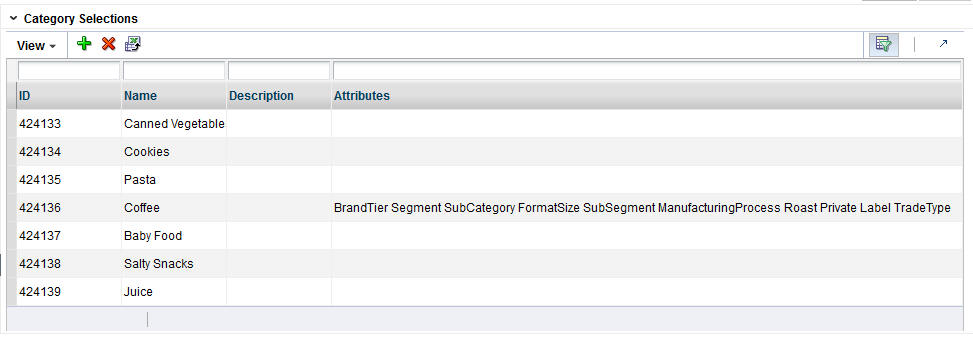
Use this table to add categories you want to include in the CDT calculation or delete categories that you want to remove from the CDT calculation.
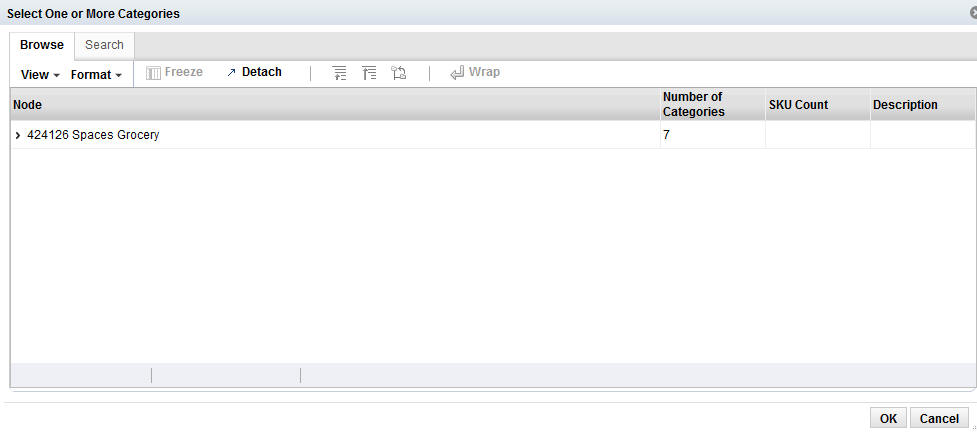
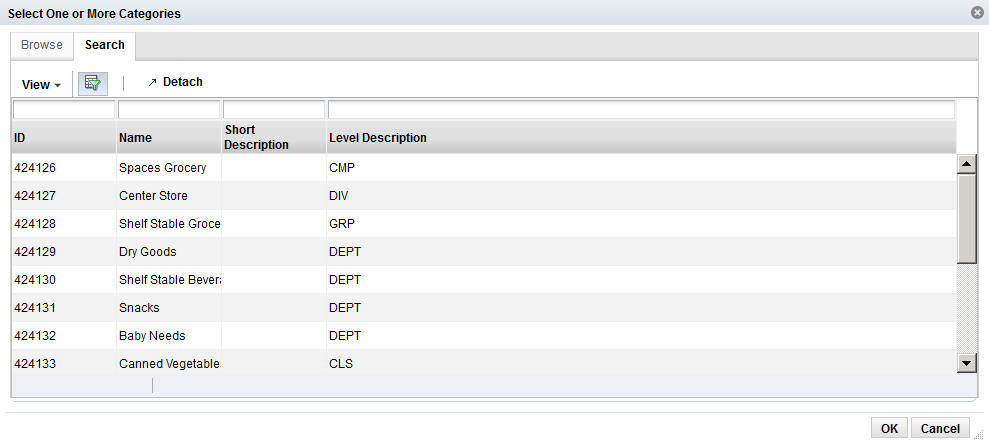
To display a list of available nodes and the categories included in those nodes, click the Add icon. You see the Select One or More Categories dialog box, which contains two tabs, Browse and Search. You can use either tab to find the categories you are looking for.
The Browse tab displays a table with the following fields:
Table 2-7 Category Selections: Browse
| Field Name | Description |
|---|---|
|
Partition |
The node tree structure can be expanded in order to view its categories. |
|
Number of Categories |
The number of categories within the node that has been selected. The number can help you understand the amount of processing required for the calculation. |
|
SKU Count |
The number of SKUs in a category. A category with too few SKUs may not produce good CDTs. |
|
Description |
A description that provides additional information about the category. |
Select the category or categories within the node that you want to be part of CDT and click OK.
The Search tab displays a table with the following fields:
Table 2-8 Category Selections: Search
| Field Name | Field Description |
|---|---|
|
ID |
An external code used to identify the category in other systems such as CMPO. |
|
Name |
The category name. |
|
Short Description |
A description that provides additional information about the category. |
|
Level Description |
A description of the level of the merchandise hierarchy that the node belongs to. |
Select the category or categories within the node that you want to be part of the CDT and click OK.
Your selections are displayed in the Category Selections table.
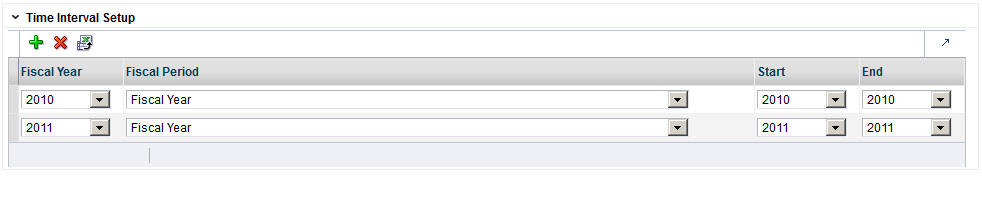
The time interval defines the time span for the historical data that is used to calculate the CDT. Only the specified weeks of sales data are used in the calculation. A group of intervals can be defined. Gaps between intervals are permitted; however, intervals cannot overlap. A six-month period is recommended.
To define a time interval for the CDT to be generated, click the Add icon. A row displays in the dialog box. Select from the following drop-down menus in order to define the time interval:
Table 2-9 Time Interval: Menus
| Menu Name | Description |
|---|---|
|
Fiscal Year |
The fiscal year for the time interval. |
|
Fiscal Period |
The fiscal period within the fiscal year (Fiscal Quarter, Fiscal Period, or Fiscal Week). |
|
Start |
This defines when the time interval specified in Fiscal Period begins. |
|
End |
This defines when the time interval specified in Fiscal Period ends. |
After selecting the category and specifying the time interval, click Next to go to the Data Filtering stage.
The Data Filtering stage applies to all the categories and time intervals that you select in the Data Setup stage.
Process
Here is the high-level process for setting up and running data filtering.
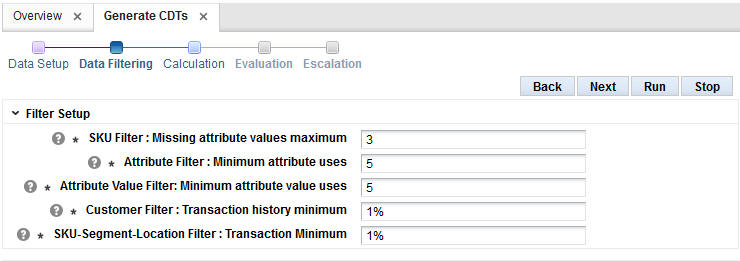
Enter the appropriate values into the Filter Setup text entry boxes.
Click Run in order to filter the data.
Review the filtering results in the Data Filtering Summary table and the Data Filtering histograms.
After reviewing the results, if necessary, make changes to the values for the filters in Filter Setup and re-run the stage.
When you are satisfied with the results, click Next to go to the Calculation stage.
You configure the following filters in order to filter out data you consider unacceptable for the calculation of the CDT. Note that the two attribute filters listed in Table 2-10 are stored and used during the Calculation stage. You also set additional data filtering parameters in the Calculation stage.
Table 2-10 Data Filters
| Data Filter Name | Data Filter Description |
|---|---|
|
SKU Filter: Missing attribute values maximum |
Each SKU is defined by its attribute values. If a certain absolute value for the attribute values is not defined, then the product definition is not accurate. A SKU with too many missing attribute values should be filtered out. The default value is 25 for the total attribute values (that is, a SKU with greater than 25 missing attribute values is not included in the calculation of the CDT). |
|
Attribute Filter: Minimum attribute uses |
An attribute that is used by only a few SKUs should be filtered out. The default value is an absolute value of 5 for the total SKUs in the category (that is, the data for an attribute that is used by fewer than five of the SKUs is not included in the calculation of the CDT). This filter does not remove t-log level data, but removes the attribute and attribute values from the CDT creation process. |
|
Attribute Value Filter: Minimum attribute value uses |
An attribute value that is used by only a few SKUs should be filtered out. The default value is an absolute value of 5 for the SKUs in a category (that is, the data for an attribute value that is used by fewer than five of the SKUs is not included in the calculation of the CDT). This filter does not remove t-log level data, but removes the attribute and attribute values from the CDT creation process. |
|
Customer Filter: Transaction history minimum |
Customers with short transaction histories are considered outliers. You assign a percentage value that is applied to the median number of transactions for all customers. Such customers are filtered out. The default value is 10% (that is, a customer who has fewer than 10% of the median number of transactions for all customers is not included in the calculation of the CDT). |
|
SKU-Segment-Location Filter: Transaction minimum |
SKUs that have few transactions for a given location-segment partition are considered outliers. You assign a percentage value that is applied to the median number of transactions for the SKUs in a specific partition. Such transactions are filtered out. The default value is 10% (that is, a SKU that is involved in fewer that 10% of the median number of transactions for a specific partition is not included in the calculation of the CDT). |
Once you have configured the filters, click Run to start the filtering process.
The following information is provided after the filtering is complete and quantifies the amount of data filtered out for the three indicated filters for sales units, sales amounts, transaction counts, SKU counts, and customer counts. Use this information to assess the effects of the pruning.
Table 2-11 Filter Data Summary Fields
| Field Name | Field Description |
|---|---|
|
Filter Name |
The following filter names are listed: Filter SKUs that are missing too many attribute values. This maps to the SKU Filter: Missing attribute values maximum in the Filter Setup. Filter SKUs that do not have enough sale transaction history. This maps to the Customer Filter: Transaction history minimum in the Filter Setup. Filter Customers that do not have typical transaction history. this maps to the SKU-Segment-Location Filter: Transaction minimum in the Filter Setup. |
|
Pre-filter Sales Unit |
Amount prior to the application of the filter. |
|
Filtered Sales Unit |
Amount remaining after the application of the filter. |
|
Pre-filter Sales Amount |
Amount prior to the application of the filter. |
|
Filtered Sales Amount |
Amount remaining after the application of the filter. |
|
Pre-filter Transaction Count |
Amount prior to the application of the filter. |
|
Filtered Transaction Count |
Amount remaining after the application of the filter. |
|
Pre-filter SKU Count |
Amount prior to the application of the filter. |
|
Filtered SKU Count |
Amount remaining after the application of the filter. |
|
Pre-filter Customer Count |
Amount prior to the application of the filter. |
|
Filtered Customer Count |
Amount remaining after the application of the filter. |
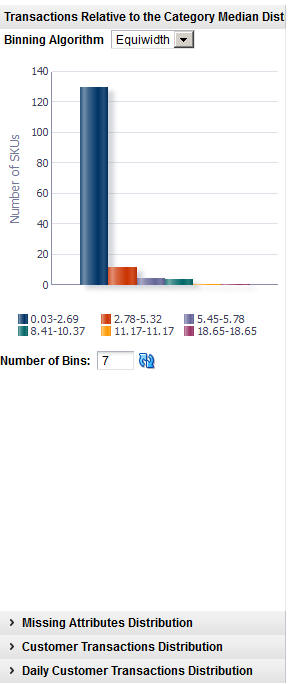
The following histograms illustrate the effects of filtering. You can use the information displayed in the histograms to adjust the configuration of the filters in order to eliminate outlier data. If you modify the filters, you must re-run the stage.
Table 2-12 Filter Histograms
| Histogram Name | Description |
|---|---|
|
Transactions Relative to the Category Median Distribution |
Displays the number of transactions relative to the category median for a SKU's category. |
|
Missing Attribute Distribution |
Displays the number of attributes that have missing values per number of SKUs. |
|
Customer Transaction Distribution |
Displays the number of transactions in historical data per number of customers. |
|
Daily Customer Transaction Distribution |
Displays the relative number of transactions per day per number of customers. |
Figure 2-11 CDT Transactions Relative Histogram
Once you are satisfied with the pruning results, click Next to go to the Calculation stage.
The Calculation stage creates the CDTs for all of the partitions that you selected in the Data Setup stage. A separate CDT calculation occurs for each partition. For example, if you selected two CMPO nodes, and the system also has two customer segments and three locations, then that is a total of 2 x 2 x 3 = 12 CDTs at the lowest level. In addition, there are CDTs at the higher levels (for example, above location).
Process
Here is the high-level process for calculating CDTs.
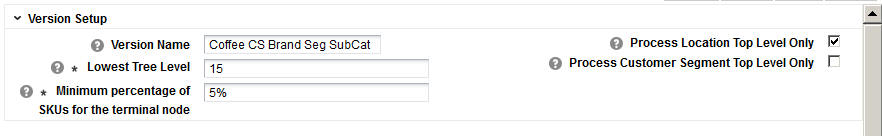
Enter a unique name for the version of the CDTs to be calculated.
Enter values for lowest tree level and minimum percentage of SKUs.
Use the check boxes to indicate whether or not only the top level processing calculation should occur for location or customer segment.
Customize the ranking of the category attributes if necessary.
Click Run to start the calculation.
Review the calculation results in the Calculation Report and the CDT Score Distribution histogram.
After reviewing the results, if necessary, make changes to the values for the calculation in Version Setup and re-run the stage.
When you are satisfied with the results, click Next to go to the Evaluation stage.
At the top of this stage you see three text boxes and two check boxes that you use to configure the levels at which the calculation occurs.
Table 2-13 Calculation Stage: Fields
| Field Name | Field Description |
|---|---|
|
Version Name |
Assign a name to each version of a CDT calculation. This allows you to create and save more than one version of a CDT. The version name you assign here is used in the Calculation Report, Aggregate Statistics table, and in the Manage CDTs tab. Version names can be re-used; however, if the version name in question has active CDTs, then you will see a warning that the active CDTS will be removed from the version if you do re-use the version name. |
|
Lowest Tree Level |
Use this option to define the maximum number of levels of CDTs to be calculated. The default value is 15. The number of levels in a CDT can at most be equal to the number of attributes used by the SKUs in the category plus 1. (The number 1 is used for the top level of the tree.) When determining the maximum number of levels, you should consider how many attributes should be represented in the tree. (For example, if you only want to see the top six attributes in the CDT, then set the lowest level to 7.) |
|
Minimum Percentage of SKUs for the Terminal Node |
Use this option to make sure the terminal nodes have a sufficient number of SKUs. For example, if the current CDT partition contains 100 SKUs, then any one node in the tree containing fewer than 5 SKUs will be considered a terminal node and the tree will not expand further along that branch of the tree. |
|
Process Location Top Level Only |
Check this option if you want CDTs to be calculated for the Location Chain only. You can select this option in order to decrease the amount of time it takes the system to perform the calculation. |
|
Process Customer Segment Top Level Only |
Check this option if you want CDTs to be calculated for the Customer Segment Chain only. You can select this option in order to decrease the amount of time it takes the system to perform the calculation. |
The application determines a specific ranking order for the category attributes. You can optionally change this order and create your own ranking of the attributes for a category by ordering the attributes from most important to least important. The Category Attributes Setup table lists the categories you are calculating CDTs for. Use this list to select a category to edit.
Click the Edit icon to access this functionality. You can adjust the ranking for all the attributes or a subset of the attributes.
Figure 2-13 CDT Category Attributes Setup
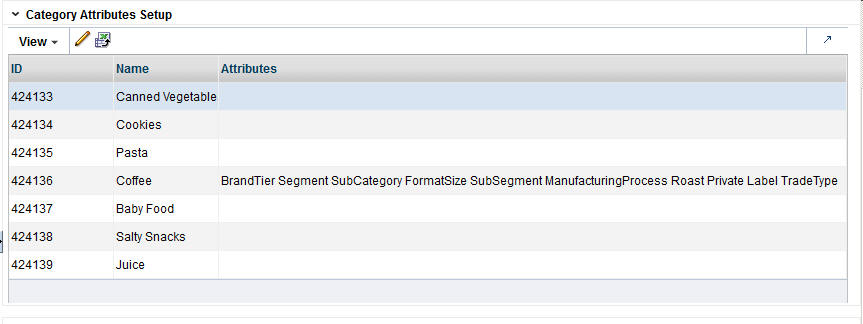
The Category Attributes Setup dialog box contains the following fields. For each attribute you want to rank, select the Top Attribute check box and enter a value for the Attribute Rank. Click OK.
Figure 2-14 CDT Category Attributes Setup
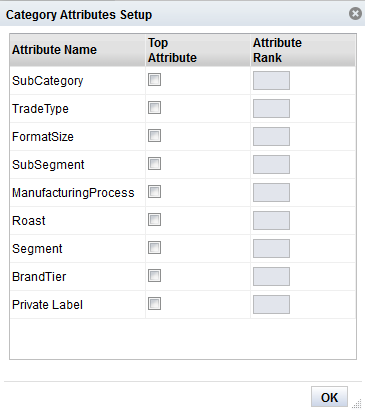
Table 2-14 Category Attributes Setup Dialog Box
| Field | Description |
|---|---|
|
Attribute Name |
Identifies the attribute. |
|
Top Attribute |
Check to enable ranking. This indicates that this attribute must be one of the first attributes in the resulting tree. This box is checked automatically for functional fit attributes and cannot be deselected. A functional fit attribute is one for which a customer cannot choose a different product with a different attribute value. For example, windshield wiper blades must be selected according to the car manufacturer's requirements. The numerical rank is optional. If you do not enter rank values, then the system will determine the order of all the top attributes first and then put any remaining attributes below the top attributes in the tree. |
|
Attribute Rank |
Enter a value for each attribute, starting with the value 1, to indicate the relative rank of the attribute. A value can be entered only if the attribute has been identified as a top attribute. You do not have to specify the rank if Top Attribute is checked. If multiple attributes are checked, then the system rank orders them. |
Once you have configured the parameters for the calculation, click Run to start the process.
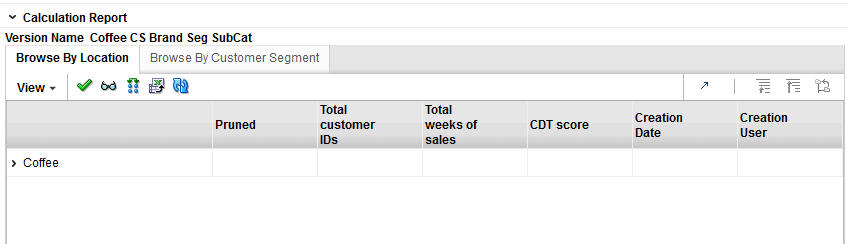
The Calculation Report displays the CDT results for the indicated version from the last successful run (if one has occurred). Here you can review information by Location or by Customer Segment. You can also set a version as active, view and edit a CDT, or compare two CDTs.
Table 2-15 Calculation Report Fields
| Field Name | Description |
|---|---|
|
Partition |
A partition is the combination of category, segment, and location. The column identifies the names of all nodes in the tree structure in the table. The node type may be either category, location, or customer segment. |
|
Pruned |
The number of CDTs removed from the list of usable CDTs. CDTs are removed that do not meet the filtering thresholds. During the Escalation stage, the escalation process makes adjustments for the CDTs that are removed. |
|
Total Customer IDs |
The number of customers used in the calculation of the CDT. |
|
Total Weeks of Sales |
The total number of weeks of sales used in the calculation of the CDT. This provides an indication of the amount of sales data used in the calculation. All the CDTs in a given version should have a similar value; if this is not the case, the results should be evaluated. |
|
CDT Score |
A confidence score assigned to help in assessing the quality of the CDT. A CDT score ranges from 0 to 100. A higher value indicates a better score. |
|
Creation Date |
The date when the version whose data is displayed was created. |
|
Creation User |
The login name of the user who created the version. |
The following icons are available for the Calculation Report:
Set Version as Complete
Each partition must have an active CDT. The active CDT is used by other applications that require a CDT.
All CDTs within a version are activated when you click Set Version as Complete.
If a CDT exists in more than one version, then the most recently activated version takes precedence.
If a version contains multiple categories and is Complete and then a different version with a partial overlap of categories is later marked as Complete, only the overlapping categories are replaced in the new version.
If a version is overwritten, then the CDTs in that version are no longer active.
When a CDT is at risk of going from active to inactive, you will see a warning message.
To determine whether or not a CDT is active, go to the Manage CDTs tab. The Browse by Categories or by Versions table displays a flag that indicates whether or not a CDT is active.
View One CDT
This icon provides access to the CDT Editor. For details about this functionality, see Using the CDT Editor.
Compare Two CDTs
This icon provides access to CDT Compare. For details about this functionality, see Comparing Two CDTs
The CDT Score Distribution histogram displays, for the current calculation, the range of CDT scores and their frequencies. CDT scores range from 0 to 100; a higher number indicates a better score. You can use the information in this histogram to assess the quality of your CDTs.
Below the histogram you see a table that provides details about the histogram. This information can help you assess the quality of a CDT. Click on a specific bin in the histogram to populate the table with information about that bin. You see a list of all the specific category name/location name/customer segment name partitions for the bin, along with the score for each, the number of weeks of data used to calculate the score, and the number of tree nodes for each partition.
Table 2-16 CDT Score Distribution Fields
| Field Name | Description |
|---|---|
|
Category Name |
The category name of the partition for the specific CDT score. |
|
Location Name |
The location name of the partition for the specific CDT score. |
|
Customer Segment Name |
The customer segment name of the partition for the specific CDT score. |
|
Score |
A confidence score assigned to help in assessing the quality of the CDT. A CDT score ranges from 0 to 100. A higher value indicates a better score. |
|
Number of Weeks |
The number of weeks of data used to calculate the CDT score. |
|
Tree Node Count |
The number of tree nodes used to calculate the CDT score. |
When you have finished with the calculation process, click Next to go to the Evaluation stage.
Once the CDT has been generated, you can evaluate it and make adjustments to parameters used in the CDT calculation during the Evaluation stage. Only the current version of the CDT, the one just generated in the Calculation stage, can be assessed in the Evaluation stage.
Process
Here is the high-level process for using the Evaluation stage to prune the results of the CDT calculation.
If you have determined that you need to prune the results of the calculation, enter appropriate values into the text boxes in the Pruning Setup area.
Click Run to start the pruning process.
Review the pruning results in the Pruning Results section and in the Pruning histograms.
After reviewing the results, if necessary, make changes to the values for the pruning and re-run the stage.
When you are satisfied with the results, click Next to go to the Escalation stage.
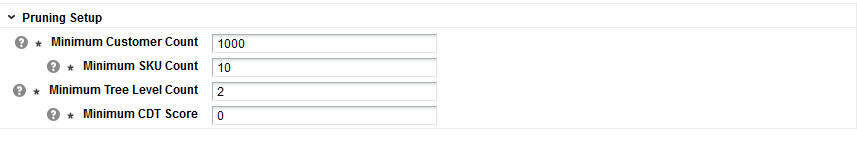
You can make changes by pruning the CDT based on the customer count, the SKU count, the tree-level count, and the minimum CDT score. To do this, enter a minimum value for each pruning filter.
Once you have completed setting up the filters, click Run to begin the processing. After you review the pruning results, you can change the values for the filters if you find it necessary. Once you make changes, you must run the stage again in order to see the results of your changes.
Table 2-17 Pruning Setup: Filters
| Filter Name | Filter Description |
|---|---|
|
Minimum Customer Count |
The minimum number of customers to be used in the CDT calculation.The default is 1000. |
|
Minimum SKU Count |
The minimum number of SKUs to be used in the CDT calculation. The default is 10. |
|
Minimum Tree Level Count |
The minimum number of levels to be used in the CDT calculation. The default is 2. |
|
Minimum CDT Score |
The minimum measure of the quality of a CDT to be used in the CDT calculation. The default is 25. |
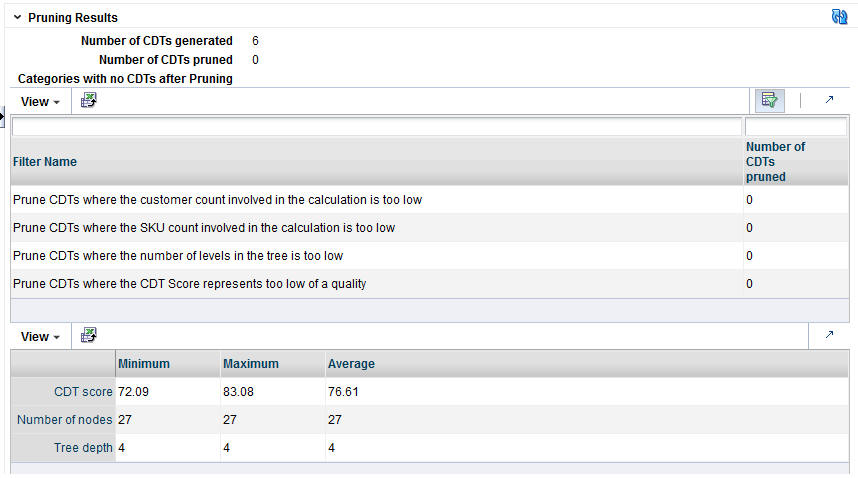
The Pruning Results are located below Pruning Setup and display information that can help you assess the effects of the values you provided for the pruning filters.
Table 2-18 Pruning Results
| Field Name | Field Description |
|---|---|
|
Number of CDTs Generated |
The number of CDTs that were generated by the Calculation stage. |
|
Number of CDTs Pruned |
The number of CDTs that were pruned after the filters were applied. |
|
Categories with no CDTs After Pruning |
The names of the categories from which all CDTs were pruned. |
Below this list is a table that identifies the number of CDTs that have been pruned by the following filters.
Prune CDTs where the customer count involved in the calculation is too low.
Prune CDTs where the SKU count involved in the calculation is too low.
Prune CDTs where the number of levels in the tree is too low.
Prune CDTs where the CDT score represents too low a quality.
A second table provides an overview of the pruning results, including the minimum, maximum, and average values for the CDT score, the number of nodes, and tree depth.
The number of nodes indicates the size of the tree. If a CDT contains few nodes, this can indicate a problem with the data or that too many nodes were excluded during the Calculation stage (because of a parameter setting).
Tree depth also indicates the size of the tree. This value can be used in conjunction with the Lowest Tree Level setting in the Calculation stage to analyze the results in terms of the number of levels in the tree.
The Evaluation Report displays the CDT results for the indicated version from the last successful run, if one has occurred. Here you can review information by Location or by Customer Segment. You can also set a version as active, view and edit a CDT, or compare two CDTs.
Table 2-19 Evaluation Report Fields
| Field Name | Description |
|---|---|
|
Partition |
A partition is the combination of category, segment, and location. The column identifies the names of all nodes in the tree structure in the table. The node type may be either category, location, or customer segment. |
|
Pruned |
The number of CDTs removed from the list of usable CDTs. CDTs are removed that do not meet the filtering thresholds. During the Escalation stage, the escalation process makes adjustments for the CDTs that are removed. |
|
Total Customer IDs |
The number of customers used in the calculation of the CDT. |
|
Total Weeks of Sales |
The total number of weeks of sales used in the calculation of the CDT. This provides an indication of the amount of sales data used in the calculation. All the CDTs in a given version should have a similar value; if this is not the case, the results should be evaluated. |
|
CDT Score |
A confidence score assigned to help in assessing the quality of the CDT. A CDT score ranges from 0 to 100. A higher value indicates a better score. |
|
Creation Date |
The date when the version whose data is displayed was created. |
|
Creation User |
The login name of the user who created the version. |
The following icons are available for the Evaluation Report:
Set Version as Complete
Each partition must have an active CDT. The active CDT is used by other applications that require a CDT.
All CDTs within a version are activated when you click Set Version as Complete.
If a CDT exists in more than one version, then the most recently activated version takes precedence.
If a version contains multiple categories and is Complete and then a different version with a partial overlap of categories is later marked as Complete, only the overlapping categories are replaced in the new version.
If a version is overwritten, then the CDTs in that version are no longer active.
When a CDT is at risk of going from active to inactive, you will see a warning message.
To determine whether or not a CDT is active, go to the Manage CDTs tab. The Browse by Categories or by Versions table displays a flag that indicates whether or not a CDT is active.
View One CDT
This icon provides access to the CDT Editor. For details about this functionality, see Using the CDT Editor.
Compare Two CDTs
This icon provides access to CDT Compare. For details about this functionality, see Comparing Two CDTs.
Three histograms are provided in the Evaluation stage.
The following histograms are displayed in the Evaluation stage. You can use the information from the histograms to understand the data that was pruned by the filters.
Table 2-20 Evaluation Histograms
| Name | Description |
|---|---|
|
Customer Count Distribution |
Displays the number of CDTs for a specific customer count. |
|
SKU Count Distribution |
Displays the number of CDTs for a specific SKU count. |
|
CDT Score Distribution |
Displays the CDT score distribution. |
Figure 2-18 CDT Customer Count Distribution
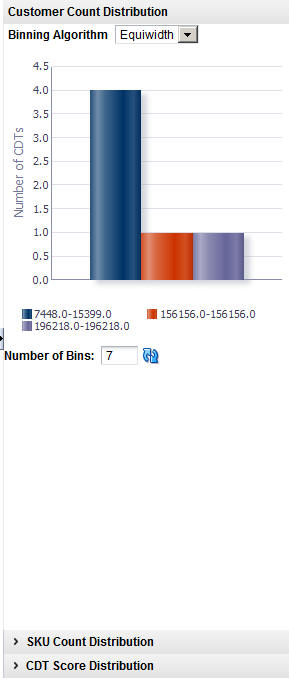
When you have completed the evaluation of the results, click Next to go to the Escalation stage.
The Escalation stage is used to fill in the holes for partitions whose CDTs were removed during pruning by setting up a search path through the segment hierarchy and the location hierarchy.
Process
Here is the high-level process for setting up an escalation.
Enter a series of numbers to indicate the escalation rank, which determines the order in which the escalation occurs.
Click Run to start the escalation process.
Review the escalation results in the Escalation Report.
After reviewing the results, if necessary, make changes to the escalation ranks and rerun the stage.
When you are satisfied with the results, you can complete the version and make the version active so that it is available for other applications to use.
Escalation occurs along the segment hierarchy and the location hierarchy. Here is an example of an escalation path:
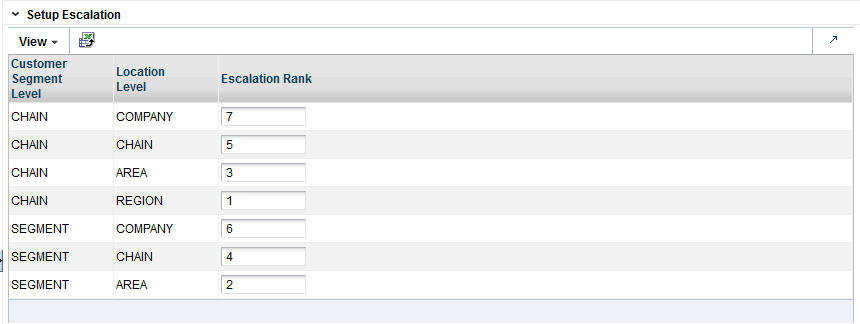
The following fields are required to set up the escalation.
Table 2-21 Setup Escalation
| Field | Description |
|---|---|
|
Customer Segment Level |
Identifies the customer segment level in the escalation. |
|
Location Level |
Identifies the location level in the escalation. |
|
Escalation Rank |
Used to assign the ranks for the escalation, which determines the order in which the escalation occurs. |
Here is an example of an escalation path.
Table 2-22 Example of Escalation Path
| Segment Level | Location Level | Escalation Rank |
|---|---|---|
|
Segment chain |
Location chain |
8 |
|
Segment chain |
Region |
7 |
|
Segment chain |
Location area |
6 |
|
Segment chain |
Store cluster |
5 |
|
Segments |
Location chain |
4 |
|
Segments |
Region |
3 |
|
Segments |
Location area |
2 |
|
Segments |
Store cluster |
1 |
You fill in the order of numbers. Every row must have an ordering number, and no ordering number can be reused.The escalation path is specific to the user and the current version that the user is working on.The default ordering is to go up the location hierarchy first, and then up the segment hierarchy, as shown in the example above. The reason is that the segment hierarchy has only two levels, and so its top level is very general.
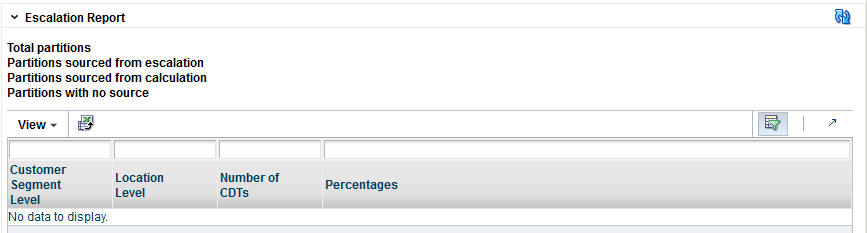
The Escalation Report breaks down the numbers to provide counts for the number of partitions filled with higher-level CDTs and the number of partitions that have not been changed by escalation. In addition, the fraction of CDTs for each partition is displayed.
Table 2-23 Escalation Report
| Field Name | Description |
|---|---|
|
Total Partitions |
The number of partitions in the version. |
|
Partitions Sourced from Escalation |
The number of partitions removed during escalation. |
|
Partitions sourced from Calculation |
The number of partitions removed during calculation. |
|
Partitions with No Source |
A partition that does not have CDTs assigned to it because all CDTs related to the partition have been pruned. |
|
Customer Segment Level |
Identifies the customer segment level. |
|
Location Level |
Identifies the location level. |
|
Number of CDTs |
The number of partitions that are trying to have a CDT assigned. This is generally the number of customer segments by the number of locations. |
|
Percentages |
The percentage of partitions that have been assigned a CDT from a given escalation level. |
When a version is complete, the results for the version are activated so that other applications can use the information. The similarity data that has been calculated during the generation process is also activated for use.
After the completion of this step, the intermediate results from each stage is removed from the database and can no longer be used.
The Manage CDTs tab is used to control which version of a CDT is active or approved. You can also access the functionality to edit a CDT or compare two CDTs.
You can find the CDT you are interested in by:
Browsing by categories or versions
Searching by version name or user name.
Set Version as Complete
Each partition must have an active CDT. The active CDT is used by other applications that require a CDT.
All CDTs within a version are activated when you click Set Version as Complete.
If a CDT exists in more than one version, then the most recently activated version takes precedence.
If a version contains multiple categories and is Complete and then a different version with a partial overlap of categories is later marked as Complete, only the overlapping categories are replaced in the new version.
If a version is overwritten, then the CDTs in that version are no longer active.
When a CDT is at risk of going from active to inactive, you will see a warning message.
To determine whether or not a CDT is active, go to the Manage CDTs tab. The Browse by Categories or by Versions table displays a flag that indicates whether or not a CDT is active.
View One CDT
This button provides access to the CDT Editor. For details about this functionality, see Using the CDT Editor.
Compare Two CDTs
This button provides access to CDT Compare. For details about this functionality, see Comparing Two CDTs.
Approve a Version
Only one approved CDT is permitted for a given CMPO node/segment/location combination. If you approve a second CDT with the same combination, it overwrites the first one.
If an Approved CDT exists, then the Approved CDT is returned to the requesting application.If no Approved CDT exists, then the Active CDT is returned to the requesting application.If no Approved CDT exists and no Active CDT exists, an error is returned to the requesting application.
Approval can be done for individual CDTs or for an entire version; activation is for an entire version.
An approved version is used by the CMPO application. An active version is used by Demand Transference.
Unapprove
Use this to change the status of a CDT that was previously approved. Select a single CDT record in the data table and click the Unapprove button to remove it from the approved version.
Delete a Version
If you delete a version, it cannot be activated. You cannot delete an approved version, but you can remove a CDT from an approved version.
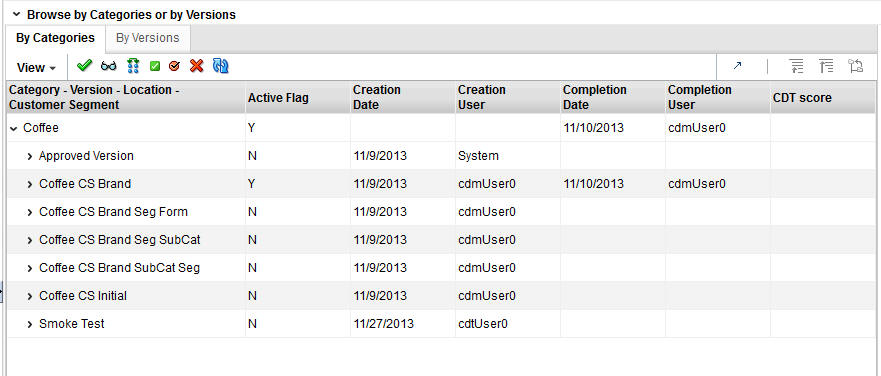
You can browse by category or version. The following information is displayed:
Table 2-24 Browsing by Category or Version
| Field Name | Field Description |
|---|---|
|
Version...Customer Segment |
Partition |
|
Active Flag |
Y = Version is active. N = version is not active. |
|
Creation Date |
Date on which version was created. |
|
Creation User |
User who created the version. |
|
Activation Date |
Date on which the version was made active. |
|
Activation User |
User who made the version active. |
|
CDT Score |
A confidence score assigned to help in assessing the quality of the CDT. A CDT score ranges from 0 to 100. A higher value indicates a better score. |
You can search by version name or creation user name. In addition, you can design a search with specific criteria and save that search for future use.
You can create a new CDT in two ways: by modifying an existing CDT or by defining a new CDT.
Click the Create CDT icon, shown in Figure 2-22.
If you want to create a new CDT based on an existing one, select the version you want to use as a template from the list of Category Selections. If you want to create a new CDT, skip this step.
Enter the Version Name for the new CDT.
Select the Product Category, Customer Segment Name, and Location Name.
Click OK. You see the CDT Editor.
You can use the CDT editor, described in "Using the CDT Editor", to edit the new CDT and add a child, make changes to a branch, or change the assigned names.
When you have finished creating and editing the new CDT, click Save CDT.
To approve the new CDT, click Approve CDT.
You can view or edit a CDT using the CDT Editor, which you access by clicking the Edit button. The CDT Editor displays the Customer Segment Name and Location Name for the CDT. It provides tools to navigate through the display using Zoom, Pan, Center, and Layout functionality.
The following functionality is available:
Add a Child
Edit
Delete
Delete Branch
Copy Branch
Paste Branch
Save and Approve
To add a child node to the CDT, do the following:
Click Add Child. You see the Add CDT Node window.
Select an attribute from the Attribute drop-down menu.
Select a value from the Attribute Value drop-down menu.
Select the Create separate branch per value check box, if applicable. When more than one of the attribute values are selected, this field create a separate node for every attribute value selected.
|
Note: A node can be created by selecting one or more attribute values. If multiple attribute values are chosen, and the check box to create a separate branch is not selected, one node that represents multiple attribute values is created.If one branch is created for all values of an attribute, select all attribute values and only one node will appear with the attribute value of ALL. If all the attribute values for an attribute are used, either by creating one node or separate nodes, a child cannot be added to the node and the Add Child is disabled. Creating a node with ALL does not associate the specific attribute values with the node. Instead, it encompasses any attribute value. |
Click OK.
Editing is allowed on all nodes as long as there are additional attribute values available. The selections from the node being edited are preselected in the dialog. The attribute cannot be changed, so the attribute drop-down menu is not disabled. Any attribute values that are in use by other siblings are not be displayed in the list.
Nodes can be deleted from the tree. There are two options for deleting: Delete and Delete Branch.
Selecting Delete deletes the selected node. Delete is available for any leaf node (a node without any children). It is also available for a non-leaf node that represents all the attributes for an attribute value: the children under this node move under the parent.
Selecting Delete Branch deletes the entire branch of nodes under the selected node, but not the selected node itself.
Copy and Paste functionality is provided to copy nodes from one branch to another. Copy Branch is enabled when a node is selected that has children. The Copy Branch function copies the full branch of children of the selected node, but not the selected node itself. Paste Branch is enabled when a branch has been copied and the selected node is a leaf node.
The Customer Decision Trees have the potential to become large and occupy more space than the screen real estate allows for. The hierarchy viewer component used to display the Customer Decision Tree provides several features to assist in viewing the Customer Decision Tree effectively.
Expanding and Collapsing Branches
One way to limit the amount of space taken up by the Customer Decision Tree is to collapse branches of the tree. For any node that has children, a small triangle appears at the bottom of the box for that node. Hovering over the triangle enlarges it and displays an option to collapse that node if it is expanded and expand the node if it is collapsed.
Moving the Tree
If the entire Customer Decision Tree is not visible on one screen, the Customer Decision Tree can be moved to make other parts of the tree visible. The view can be moved by either clicking and dragging or by using the panning controls in the control bar for the hierarchy viewer.
Zooming
The hierarchy viewer provides some controls for zooming in and out to allow more or less of the tree to be in view at a time. Zooming out shrinks the size of the nodes, which may make them difficult to read.
You can also compare two CDTs using the same CDT Editor functionality. You select the two CDTs you want to compare from the list. Both CDTs are displayed side by side.