| Oracle® Retail Science Cloud Services User Guide Release 18.0.002 F17712-02 |
|

 Previous |
 Next |
This chapter describes the Customer Segmentation module.
Customer segmentation is an enterprise-specific solution that uses data mining to group customers based on customer attributes and customer transactions. The retailer can use this information to describe and predict customer behavior. It provides the retailer with a vehicle to target customers with offers, pricing, assortment, and experience.
Retailers understand that shoppers are heterogeneous in nature, that they possess different wants and needs, and that it is impossible to satisfy them all. Retailers can differentiate themselves from their competitors by specializing and offering goods and services that are tailored to one or more market segments.
Customer Segmentation can be used to group customers and to discover hidden customer segments based on the contents of customer shopping baskets and the number of shopping trips they make. Loyalty card data is used to determine if these customer segments differ in terms of socio-demographic or lifestyle characteristics and whether these characteristics can be used to target different customer segments with more relevant product offers.
Retailers can create localized assortments and use customer insights to determine which products to offer by location or channel. This provides insights into the importance of a product to key customer segments and helps when making drop or keep decisions about products within an assortment.
This science-driven tool helps to automate segmentation in a repeatable process and bridges the gap between targeted marketing to targeted assortments.
The key features of Customer Segmentation include:
Scenario-based segment generation, based on customer attributes, customer behavior, and transactions.
Attribute importance and correlation mining to identify significant attributes and their associations.
The ability to generate granular customer segments via the UI. These customer segments include departments such as men, women, and children, health and beauty, or groceries.
A three-step segment-generation process.
What-if capabilities that can be used to create multiple segmentation scenarios and then measure them against one another. This can help ensure that the most appropriate segments are used by the applicable planning and execution processes.
Automatic ranking of segment scenarios to support what-if comparisons.
Recommendations for the optimal segment scenario and number of segments.
Descriptions of the main characteristics of the data assigned to each segment using segment rules.
The use of Oracle data mining hierarchical segmentation and an enhanced version of the k-means algorithm.
To use Customer Segmentation, follow this general process to create segments, working in the Generate Customer Segment tab:
Versions – Perform preprocessing actions such as filter and sample a customer's shopping-specific categories or departments. Also identify important attributes that are specific to merchandise and location for customer segmentation.
Segment Criteria – View all available segments for the specified merchandise, location, and calendar. Review the segment criteria or scenario details for each segment. Use an existing segment as the basis for creating a new segment.
Explore Data – Examine attributes and their summaries for the segment. Review multiple significant attributes and their correlations using the contextual information.
Segment Setup – Define multiple what-if scenarios. Such scenarios can be compared with one another throughout the segmentation process.
Segment Results – View the scenario results and compare scenarios.
Segment Insights – Gain an understanding about segment results and segment performance prior to approval by examining the contextual information.
The Customer Segmentation Overview tab displays a list of the most recently defined segment criteria and provides the status, segmentation criteria, and applicable merchandise, location, and calendar nodes. You can click on the criteria names in order to access them within the Generate Customer Segments tab.
Figure 5-1 Customer Segmentation Overview Tab
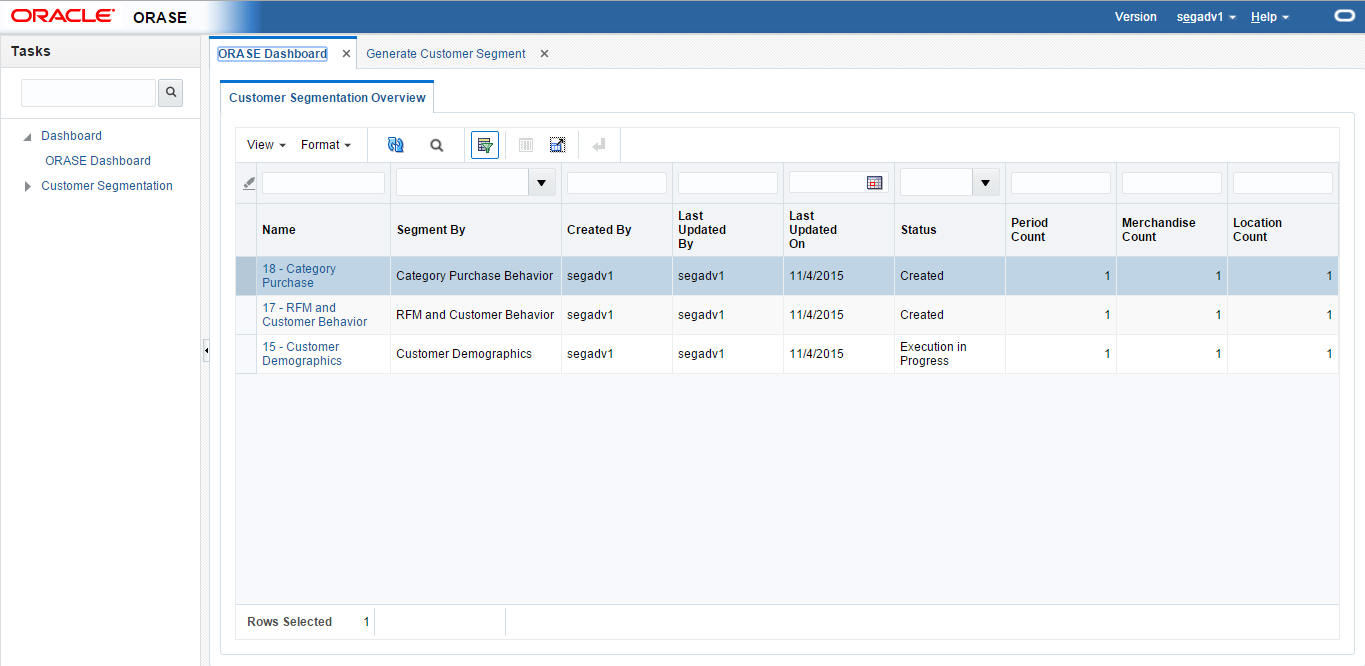
Table 5-1 Cluster Criteria Overview Tab
| Field | Description |
|---|---|
|
Name |
The criteria ID and user-assigned name of the segment. |
|
Segment By |
The Segment By option used for the segment. |
|
Created By |
The name of the user who created the segment. |
|
Last Updated By |
The name of the user who most recently updated the segment. |
|
Last Updated On |
The date when the segment criteria were most recently updated. |
|
Status |
The most recent, up-to-date status across the scenarios for the segment criteria. Value include Created, Ready for Preview, Ready for Approval, Approved, and Rejected. |
|
Period Count |
The number of calendar nodes defined for the criteria. Hover over the count in order to see a list of the calendar keys associated with the criteria. |
|
Merchandise Count |
The number of merchandise nodes defined for the criteria. Hover over the count in order to see a list of the merchandise keys associated with the criteria. |
|
Location Count |
The number of location nodes defined for the criteria. Hover over the count in order to see a list of the location keys associated with the criteria. |
The following segmentation criteria are supported by default:
Customer Demographics
This descriptive segmentation technique leverages customer loyalty programs and demographic information (such as residence, profession, age, gender, ethnicity, marital status, and education) about customers to generate demographics based on customer segments.
RFM and Customer Behavior
Segmentation based on purchase behavior aims at discovering groups of customers who exhibit similar purchasing behavior. However, the definition of behavior in this context includes many factors. For example, retailers may want to distinguish between light and heavy users, regular stock-up shoppers versus emergency top-up shoppers, lunchtime shoppers versus evening shoppers, home and daytime shoppers versus work and weekend shoppers, or fast-checkout customers versus regular checkout customers. The two important behavioral dimensions for understanding customer motivations are visit behavior (identified by the time of day and the day of week that the visits take place) and shopping behavior (identified by the customer's spend dispersion across categories purchased during the trip).
Category Purchase Behavior
Another type of behavior segmentation aims at segmenting the customers who seek similar benefits when evaluating and choosing or purchasing products. These benefits can be measures such as economical price, bulk products, durability, or free shipping. Here, the segment process considers factors that capture customer sensitivity to price and promotions for each category. This can help retailers to segment customers by distinguishing predicted customer responses to the targeted or general promotion of products.
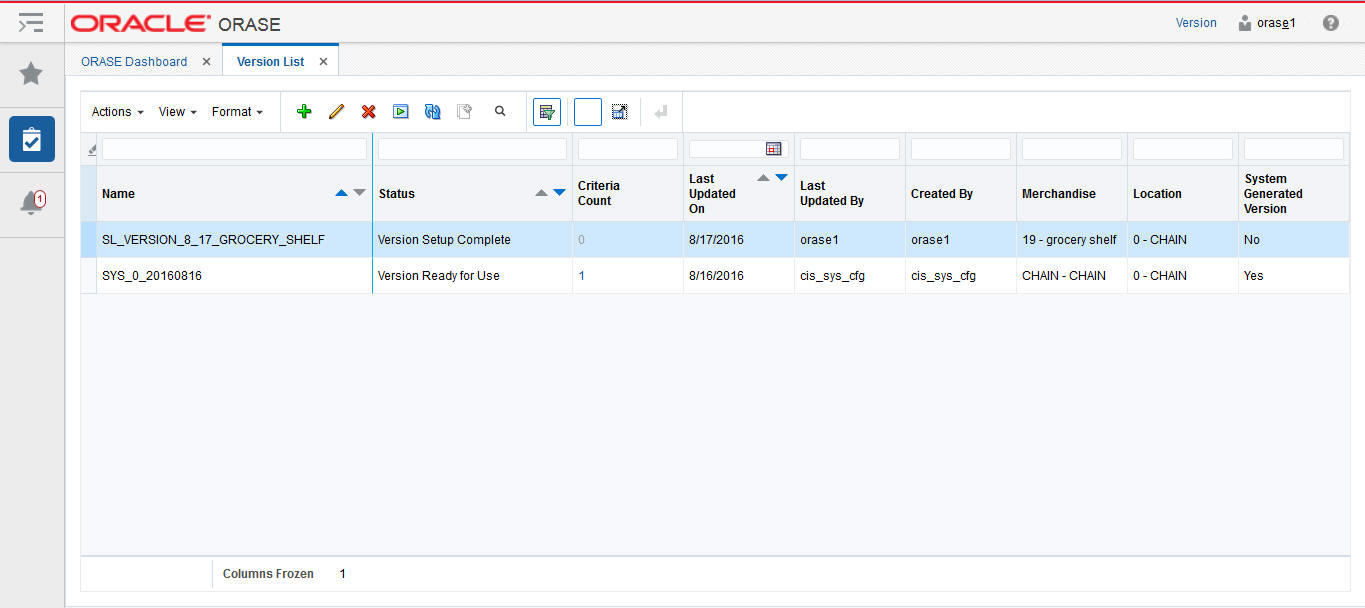
The Version List tab is used to review, define, and execute preprocessing criteria for customer segments. Version criteria allow users to define versions for merchandise and location combinations. These preprocessed versions can be used to generate customer segments at global or granular levels for merchandise and location. The user can then perform version actions such as creating, updating, and deleting versions and can use selected versions to define new segment criteria.
The Version List, which, by default, lists the global segment version, is defined as part of the batch process. This version is defined for all merchandise and all locations. The version has three key components: filtering, sampling, and attribute mining. It helps when performing the preprocessing of granular customer segments for departments such as men/women/children or segments such as heath and beauty, because customers who are shopping for such categories can differ from customers who are shopping for groceries. These segments can be used by applications such as CMPO for planning at the global level or for promotion planning for granular level segments. The version list is sorted by last update, in descending order. The version status is sorted in descending order. The name is sorted in ascending order. Searching, using QBE and a search panel option, is provided for both basic and advanced searches.
The following actions are available.
Create, edit, and delete a version. If a version has a status of Ready for Use and at least one segment is associated with the version, then edit and delete are not available.
Execute version. This is available when the setup is complete.
Create a customer segment using an existing version. This opens the Generate Customer Segment tab. The New Segment Criteria pop-up is displayed, and the default values are filled in. (See the defaults that are selected on selection of the version in segment criteria.) This option is only available if the version has a status of Ready for Use.
Table 5-2 Version Details
| Name | Description |
|---|---|
|
Name |
The name of the version. |
|
Criteria Count |
The number of criteria associated with the version. When you click the link, a pop-up is displayed that lists the segment criteria details that are associated with the version. |
|
Last Updated By |
The name of the user who updated the version most recently. |
|
Last Updated On |
The date when the version was last updated. |
|
Created By |
The name of the user who created the version. |
|
Status |
The current status of the version. Values include Version Setup Complete, Filtering Completed, Sampling Completed Successfully, Attribute Mining Completed Successfully, Version Ready for Use. |
|
Merchandise |
The merchandise node defined for the version. |
|
Location |
The location node defined for the version. |
|
System Generated Version |
This column provides a flag indicating whether or not the version has been created using a batch process and is set up with a default configuration. |
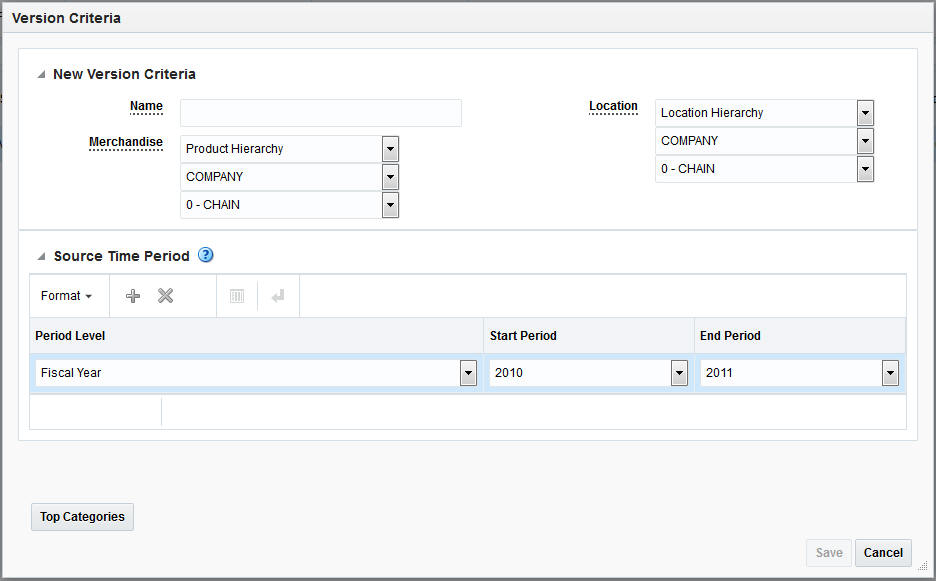
Merchandise
Once you choose the merchandise level for the version, you must select the hierarchy node. The merchandise defined as part of the version is then used for creating segments.
Location
Once you choose the location level for the version, you must select the hierarchy node. These are specific to the location level you select. The location defined as part of the version is then used for creating segments.
Select historical sales data for the version. You can specify more than one time period. Source time periods selected as part of the version are then applicable for the segments.
Table 5-3 Source Time Period
| Time Period | Description |
|---|---|
|
Period Level |
Select from Fiscal Year, Fiscal Quarter, Fiscal Period, or Fiscal Week. |
|
Start Period |
Once you select the Period Level, select the starting subdivision within that period. |
|
End Period |
Once you select the Start Period, select the End Period. |
Use this pop-up to select top categories by reviewing category KPIs, such as Sales Share, Revenue, and Margin. The system selects the top categories by each department. You can override these top categories further while defining versions for merchandise. By default, the top categories in the selected merchandise are driven based on the sales share for each category. You can remove categories to reduce processing time and storage, using the user interface and adding emerging to the top category list.
Version Status
The version status has one of the following values.
Table 5-4 Version Status
| Status | Description |
|---|---|
|
Version Setup Complete |
Indicates that version setup is complete. |
|
Filtering Completed with Errors |
Indicates that version filtering has completed with errors. |
|
Filtering Execution in Progress |
Indicates that version filtering is in progress. |
|
Filtering Completed Successfully |
Indicates that version filtering has completed successfully. |
|
Sampling Completed with Errors |
Indicates that sampling has completed with errors. |
|
Sampling Execution in Progress |
Indicates that sampling execution is in progress. |
|
Sampling Completed Successfully |
Indicates that sampling has completed successfully. |
|
Attribute Mining Completed with Errors |
Indicates that attribute mining has completed with errors. |
|
Attribute Mining Execution in Progress |
Indicates that attribute mining execution is in progress. |
|
Attribute Mining Completed Successfully |
Indicates that attribute mining has completed successfully. |
|
Version Ready for Use |
Indicates that all three execution phases (filtering, sampling, and attribute mining) have completed successfully. Once the version is ready for use, it is ready for the creation of segment criteria. |
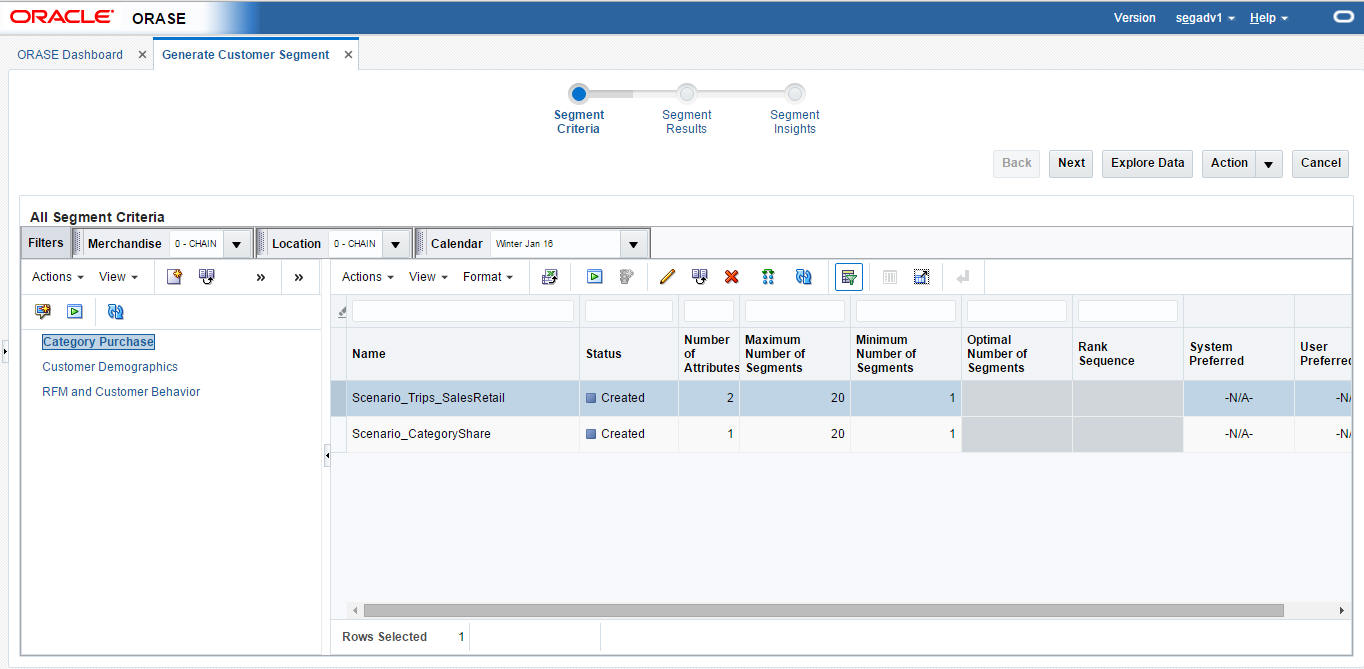
The Generate Customer Segments tab is used to create segments and then model the segments with various scenarios in order to determine the best set of segments. It consists of three stages: Segment Criteria, Segment Results, and Segment Insights.
Figure 5-5 Generate Customer Segments Tab
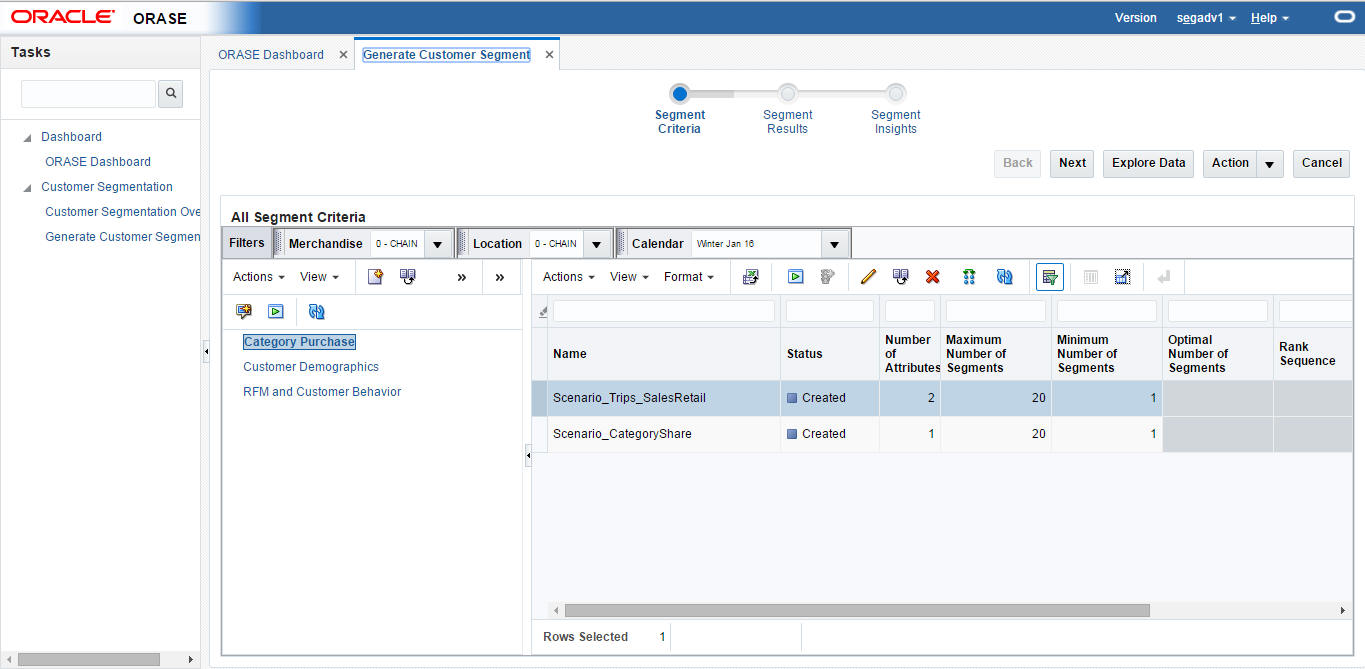
Use the Segment Criteria stage to view summary data about existing segments and define the characteristics of new segments.
Process
Here is the high-level process for defining a segment.
Provide a unique name for the segment.
Define the type of data used to characterize the segment.
Select the merchandise and location nodes.
Define the time period for the segment.
Define the historical time period for the data.
In this area of the page you can view information about existing segments.
Use the View list to select existing segment criteria. You can tailor your search for existing segment criteria by Merchandise, Location, and Calendar. Once you select the segment criteria, the defining details for the segment criteria are displayed in the Worksheet area.
In addition, you can use the toolbar buttons to:
Create segment criteria. You can define an initial segment. The criteria include segment name, the merchandise for the segment, the effective date for the segment, and the history to use.
View or edit segment criteria. The characteristics of the segment are displayed in the Segment Criteria pop-up.
Copy segment criteria. Once you have copied the criteria, you can modify them.
Delete segment criteria. Delete the selected segment criteria.
Execute segment criteria. Execute all non-executed scenarios for the selected criteria.
Evaluate KPIs after the execution of the scenario is complete.
Refresh all. Refresh all segment criteria in order to view any updates to the existing segment criteria.
Once you have highlighted the segment criteria to examine, details about the segment criteria are displayed in a pop-up.
The details include information about the segment criteria and the scenarios created for segment criteria.
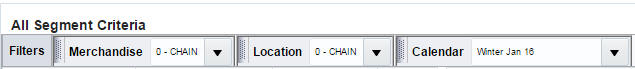
Merchandise allows the user to filter the existing segment criteria by searching for or selecting the merchandise for the supported hierarchies.
Location allows the user to filter the existing segment criteria by searching for or selecting the location for the supported hierarchies.
Calendar allows the user to filter the existing segment criteria by searching for or selecting the calendar for the supported hierarchies.
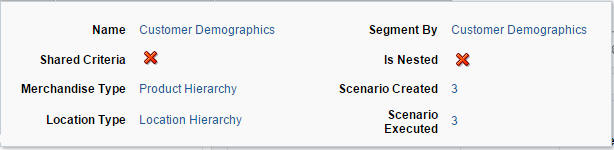
Once you have highlighted the segment criteria to examine, details about the segment criteria are displayed in a pop-up.
The details include information about the segment criteria and the scenarios created for the segment criteria.
Table 5-5 Pop-Up Details
| Field Name | Description |
|---|---|
|
Name |
The name of the segment criteria. |
|
Shared Criteria |
A check mark indicates that more than one merchandise or location node is used in the segment criteria. |
|
Merchandise Type |
The merchandise type. |
|
Location Type |
The location type. |
|
Segment By |
A set of attributes to be used in the creation of the segment criteria: Customer Demographics, RFM and Customer Behavior, Category Purchase Driven. |
|
Scenario Created |
The number of scenarios created for the segment. |
|
Scenario Executed |
The number of scenarios executed for the segment. |
This displays the scenarios for the selected segment criteria in the All Segment Criteria tree.
Table 5-6 Scenario List
| Field Name | Description |
|---|---|
|
Name |
The name assigned to each scenario that has been created for the segment. |
|
Status |
Created, Ready for Preview, Ready for Approval, Completed with Errors, Approved, Rejected. |
|
Rank |
The system-calculated rank for the segment. |
|
Optimal # of Segments |
The system-calculated optimal number of segment centers. |
|
User Preferred |
Indicates whether or not the user prefers the segment. |
|
System Preferred |
Indicates whether or not the system prefers the segment. |
|
# of Attributes |
The number of attributes that were used in the segment. |
|
Max. # of Segments |
A user-provided value for the maximum segment centers that the segmenting process should consider. |
|
Min. # of Segments |
A user-provided value for the minimum segments centers that the segmenting process should consider. |
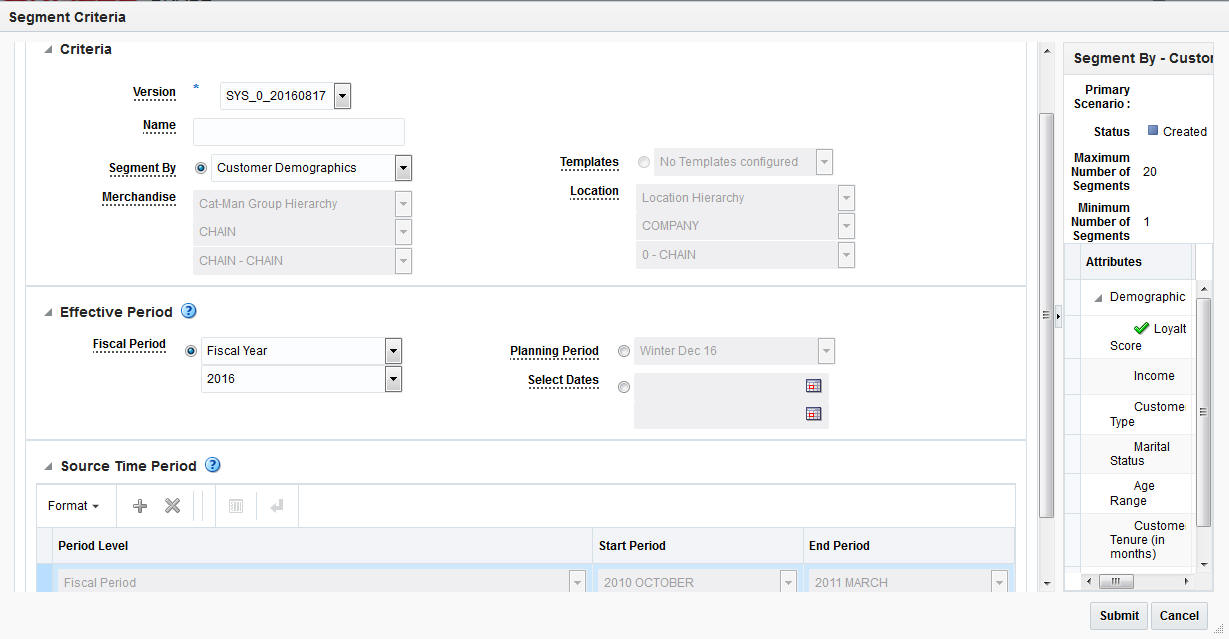
In this pop-up, you define the initial segmenting parameters for the segment criteria of a new segment. Note that the hierarchy type supported can be configured at the time of deployment.
Figure 5-10 illustrates how to use a simple approach to segmenting by selecting attributes from a Segment by. For example, you can select the RFM and Customer Behavior Segment by and generate segments using the total number of trips and the amount spent by customer.
The following information defines a segment:
Table 5-7 New Segment Definition
| Field Name | Description |
|---|---|
|
Name |
A unique name to identify the segment. |
|
Version |
Select a predefined version to use for creating segment criteria. When the version is selected, the merchandise and location are selected, based on the version. |
|
Segment By |
A predefined group of attributes that include Customer Demographics, RFM and Customer Behavior, Category Purchase Driven. These criteria types are sets of attributes. For example, customer demographics are the properties of a customer. These properties can include ethnicity, income, and age. |
|
Merchandise |
Merchandise is selected based on the version selected for the segment criteria. |
|
Location |
Location is selected based on the version selected for the segment criteria. |
|
Template |
Template is selected based on the version selected for the segment criteria. |
You can define a time interval for the segment by either choosing a period from the list provided or by selecting a start date and an end date.
To define the Effective Period, you select either Planning Period, Fiscal Period, or Select Date.
Table 5-8 Effective Period
| Option | Description |
|---|---|
|
Fiscal Period |
If you select this option, choose the period and the subdivisions of that period from the drop-down lists. |
|
Planning Period |
Select from the range of values provided for the period. Planning periods are user-defined buying periods for a season or a season subset. |
|
Select Dates |
If you select this option, choose the start and end dates using the calendar pop-up. |
Data summarization is available by default and set to either Category or Sub Category. It is applied to Category Purchase Driven Segment by. The segmentation process considers the top selected categories and their attributes and groups customers based on their sales patterns.
Source time periods are selected based on the version selected for the segment criteria.
Table 5-9 Source Time Period
| Field | Description |
|---|---|
|
Period Level |
Select from Fiscal Year, Fiscal Quarter, Fiscal Period, or Fiscal Week. |
|
Start Period |
Once you select the Period Level, you select the starting subdivision within that period. |
|
End Period |
Once you select the Period Level, you select the ending subdivision within that period. |
When you are creating new segment criteria, you can see details about the following parameters that can help you understand the segment you are creating.
The following information is displayed when you select a template or use the icon to select the Segment by.
Table 5-10 Template Display
| Property | Description |
|---|---|
|
Template Name |
Name of template configured during deployment. |
|
Description |
Description of template. |
|
Segment By |
A predefined group of attributes that include Customer Demographics, RFM and Customer Behavior, Category Purchase Driven. These criteria types are sets of attributes. For example, customer demographics are the properties of a customer. These properties can include ethnicity, income, and age. |
You see this when you select Segment by in the Criteria panel when you are setting the segment criteria parameters or when you select Segment by in the contextual area for the hierarchy.
The system displays the primary scenario, its preconfigured properties, and the significant attributes identified during the attribute importance process for each segment by.
The following information is displayed.
Table 5-11 Primary Scenario
| Property | Description |
|---|---|
|
Name |
The name of the primary scenario. |
|
Status |
Created, Ready for Preview, Ready for Approval, Completed with Errors, Approved, Rejected. |
|
Maximum # segments |
The maximum number of segments. The default value is 20. This is used for analyzing the segments. |
|
Minimum # segments |
The minimum number of segments. The default value is 1. This is used for analyzing the segments. |
|
Attribute |
A list of the attributes configured during segmentation. |
|
Attribute importance |
The weighted average across attributes and importance index for each attribute. |
This list displays the time period you selected for the segment criteria. This information is available only for planning periods, where it provides the start and end dates of the planning period. This content changes whenever the planning period is selected in Effective Period when you are setting segment criteria parameters.
Use the Explore Data pop-up to examine data for the segment criteria you defined. You can view the customer and attribute summary that provides input into the segmentation process.
Process
In this pop-up you can view criteria and attribute summaries as well as their related contextual BIs.
The Summary lists the criteria you initially selected to define the segment.
Table 5-12 Explore Data: Summary
| Field | Description |
|---|---|
|
Name |
The name you provided for the segment in the Segment Criteria stage. |
|
Segment By |
A predefined group of attributes that include Customer Demographics, RFM and Customer Behavior, Category Purchase Driven. These criteria types are sets of attributes. For example, customer demographics are the properties of a customer. These properties can include ethnicity, income, and age. |
|
Merchandise |
The merchandise level and nodes for the segment. |
|
Location |
The location level and nodes for the segment. |
|
Fiscal Period |
The time period for the segment. |
|
Merchandise Hierarchy Type |
Details about which type of hierarchy the segment criteria have been created for. |
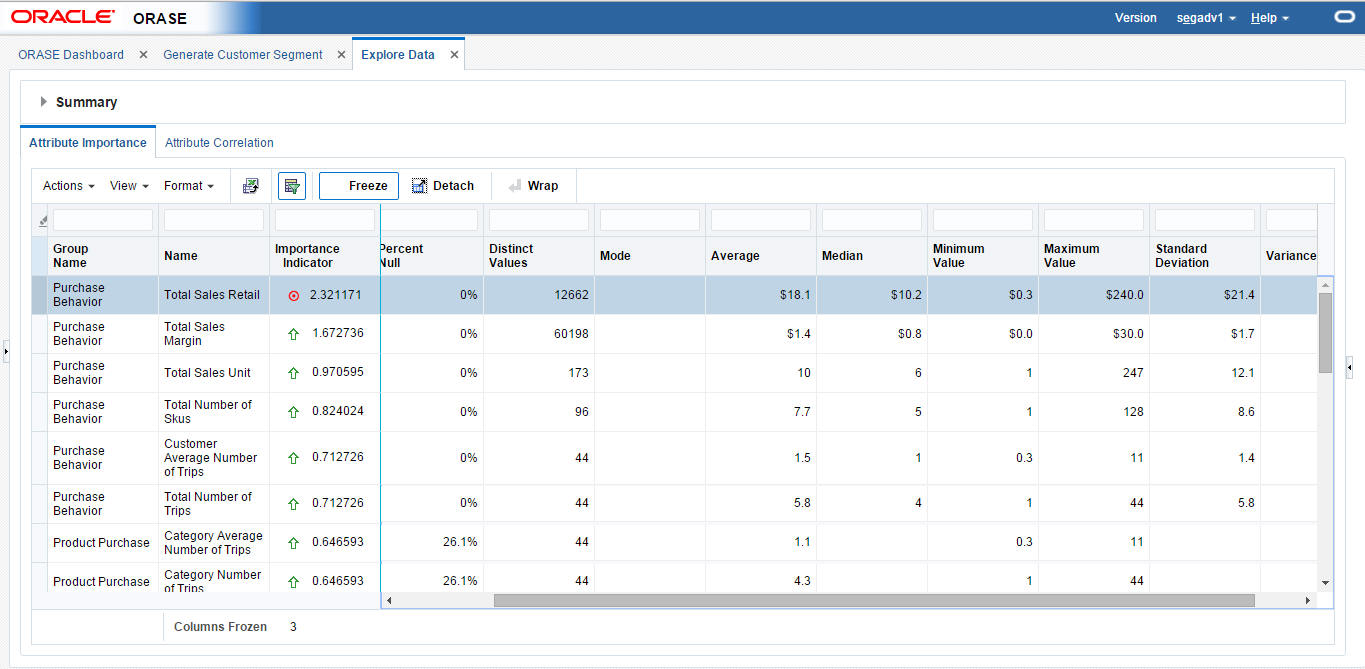
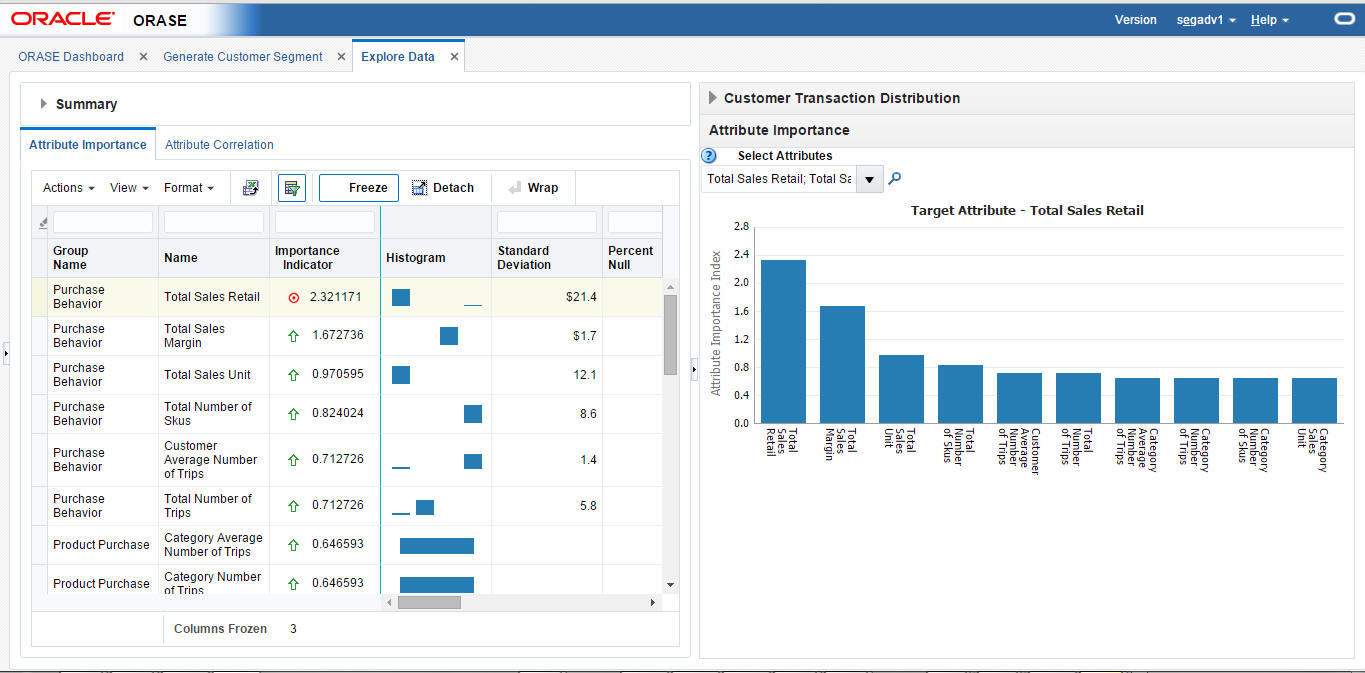
This screen provides you with insights about the attribute mining process, which lists the attributes' significance and their correlations. The attributes required for the customer segmentation process come from different dimensions such as customers, their households, demographics, and purchasing behaviors. This process helps to eliminate redundant attributes and to identify the attributes that may have the most influence on generating customer segment. The attribute summary displays information about data availability and data quality by providing the attributes' distinct values, percentage of nulls, and statistics summaries, such as mean, median, and standard deviation.
Along with attribute summaries, the system generates an attribute importance index that sums up data quality, data distribution, and its representation of each attribute in the data. See Figure 5-11.
The system indicates the relative importance of attributes, based on upper and lower threshold values.
Table 5-13 Attribute Importance Values
| Category | Range |
|---|---|
|
Low Importance |
Minimum value for the lower threshold, indicated in red. |
|
Average Importance |
Values between the lower threshold and the upper threshold, indicated in yellow. |
|
High Importance |
Values above the upper threshold are indicated in green and are the best candidates for mining attributes. |
The following attributes are displayed in Attribute Importance.
Table 5-14 Attributes
| Attribute Name | Description |
|---|---|
|
Group Name |
The attribute group name (attributes such as demographics, purchase behavior, or product profile). |
|
Name |
The name of the attribute (for example, income, ethnicity, or total sales retail) |
|
Histogram |
The spark chart for displaying the attribute distribution. This corresponds to the current data distribution graph. |
|
Importance Indicator |
The attribute importance index with an image to indicate if attribute has high, average, or low importance. |
|
Percent Null |
The percentage of data that is null for the attribute. |
|
Distinct Value |
The distinct value applicable to discrete attributes. If no value is available, this is empty. |
|
Mode |
The most common value of the discrete attributes. If no value is available, this is empty. |
|
Average |
The mean value of the numeric attributes. If no value is available, this is empty. |
|
Median |
The median value of the numeric attributes. If no value is available, this is empty. |
|
Minimum Value |
The minimum value of the numeric attributes. If no value is available, this is empty. |
|
Maximum Value |
The maximum value of the numeric attributes.If no value is available, this is empty. |
|
Standard Deviation |
The standard deviation indicates the deviation from the average for the numeric attributes. If no value is available, this is empty. |
|
Variance |
The variance indicates the dispersion from the average for the numeric attributes.If no value is available, this is empty. |
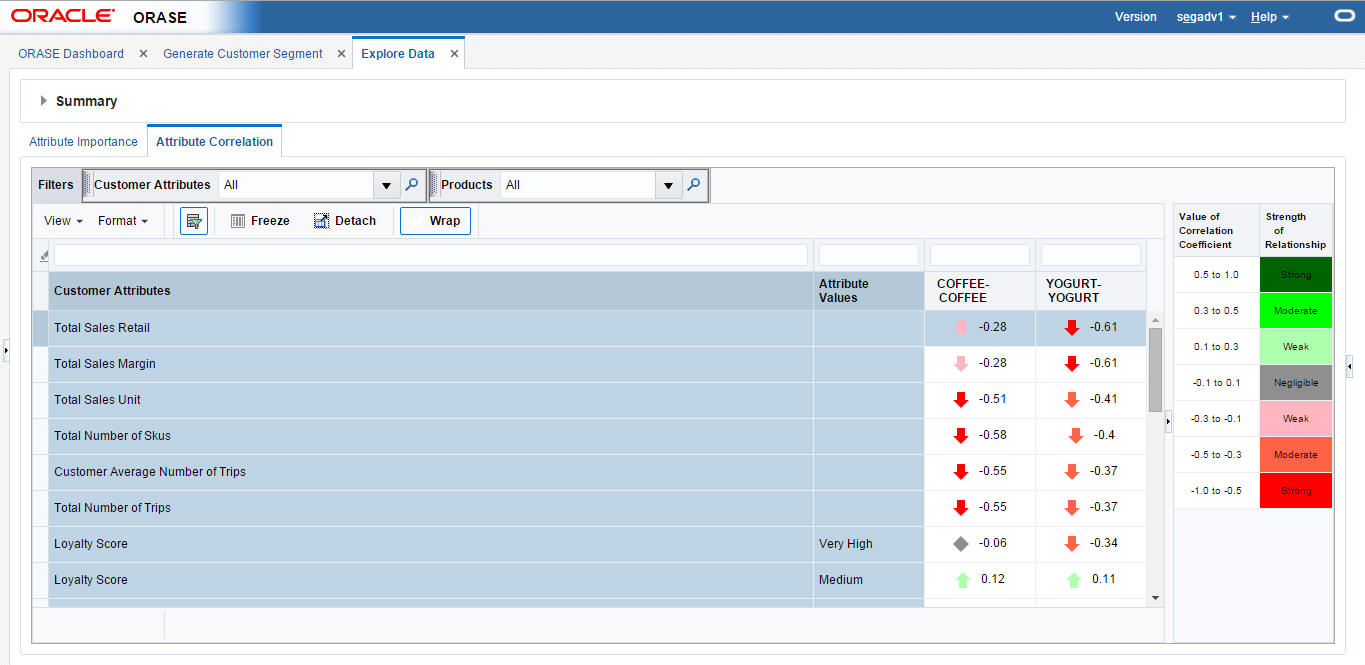
The attribute mining process generates a correlation between customer attributes and products. This information can help you understand which combination of customer attributes may drive product purchase behavior.
You can use customer and product filters to reduce the number of customer and product attributes that are displayed in the correlation matrix.
The correlation matrix displays attributes, attributes values (in the case of discrete attributes), and correlations between customer and products. Each cell in the matrix provides a visual indication of how attributes are correlated, along with the correlation value. Various colors indicate the strength of the correlation among attributes, with -1 and 1 indicating strong association.
Table 5-15 shows the strength of the correlation for the different ranges of values for the correlation coefficient.
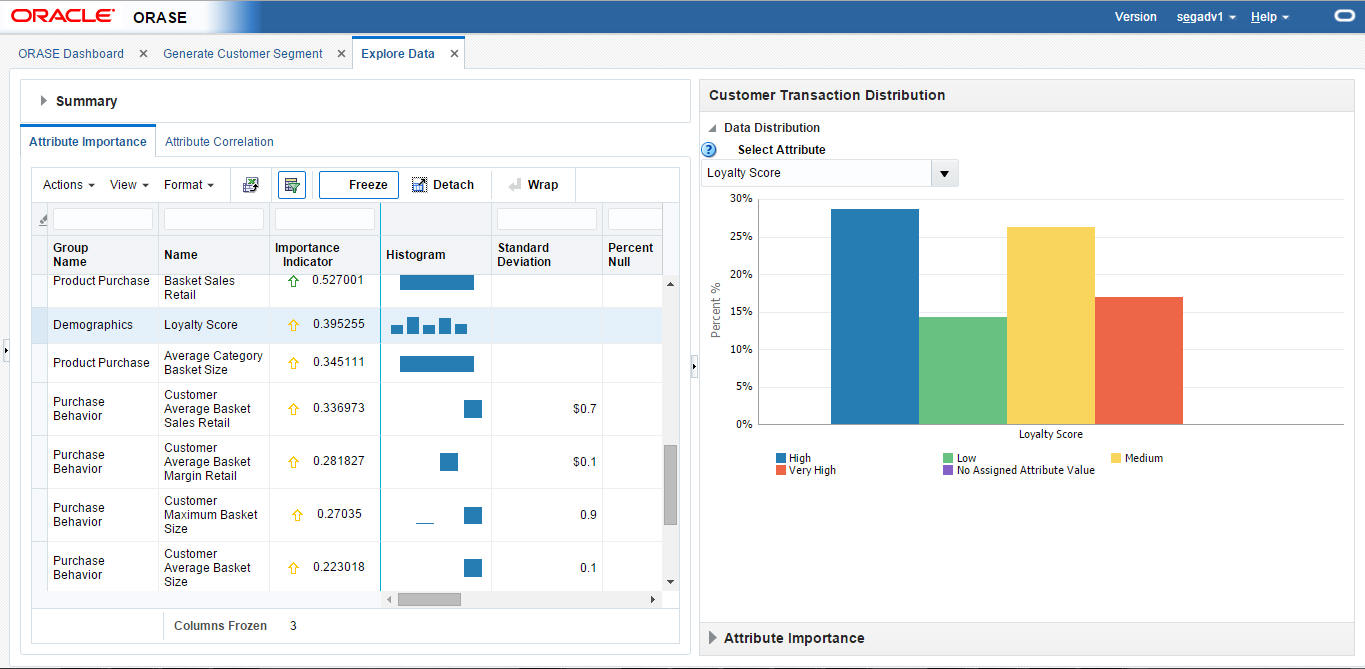
This area provides graphical illustrations of the detailed data distribution about the customers and their attribute importance.
In Explore Data, the BI displays the data distribution of the customers by each participating attribute as well as other configured informational attributes. Customer Segmentation identifies the bins based on the underlying sample data and displays the histograms. It provides the percentage of customers that are present in a selected location. For example, a company may have ten percent of premium customers who are high spenders and who shop frequently.
The attributes are ranked in order of their significance in predicting a target (the default is set to Customer Total Spent) and by analyzing the quality and variability of the data. The results in Figure 5-15 shows that loyalty score and income have the most effect on whether or not the customer spends more shopping at the retailer.
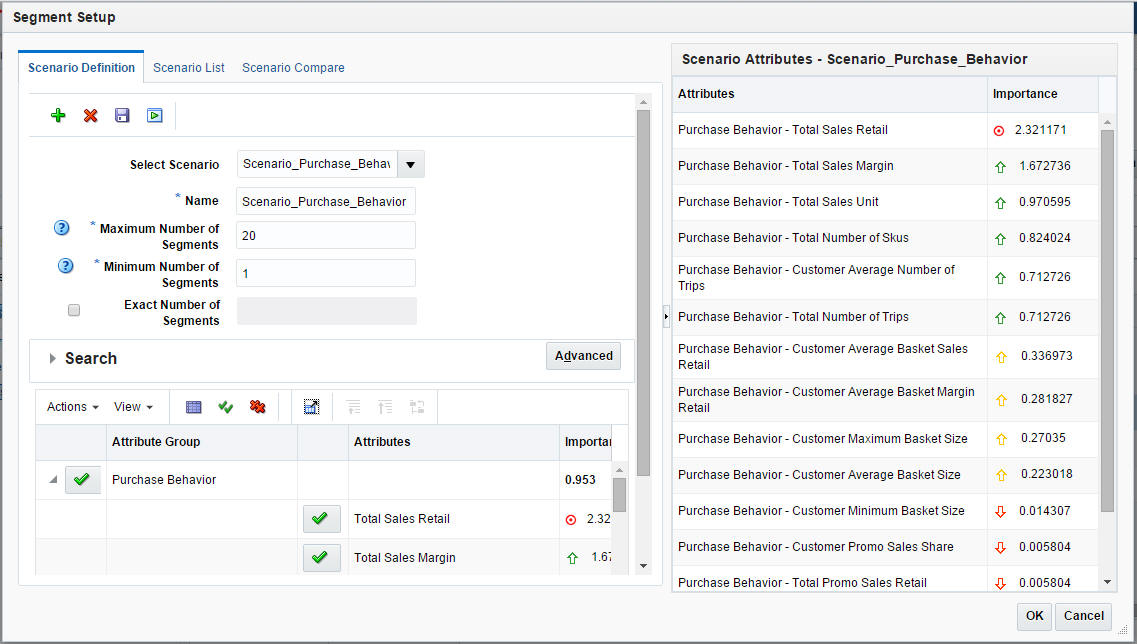
You can use this stage to perform what-if analysis by defining one or more scenarios that are based on a specified number of segments and attributes. You can select one or more attributes based on the attribute importance index. The attribute importance index guides you when you are defining the scenario setup. Using these scenarios, you can experiment with different numbers of segments and participating attributes. You can either define the maximum number or the minimum number of segments or alternatively define a specific number of segments that you want to be generated. Once the scenarios are generated, different scenarios can be compared. You can also use other features in this stage to copy or delete scenarios.
Process
Here is the high-level process for setting up scenarios.
Either select the name of a scenario you want to modify or enter the name for the new segment criteria you want to create.
If you want the application to optimize the number of segments, enter the minimum and maximum values for the number of segments.
If you want the application to generate a specific number of segments, enter that value. In this case, the application generates the exact number of segments and provides the optimal number of segments as informational data.
Optionally, review the attribute importance assigned to the attributes and select an attribute if you want a specific attribute to be part of the segmentation process.
Click the Execute icon to execute the scenario. Once the processing is complete, you see the results in the Segment Results stage.
To see a list of all scenarios and the status for each, go to the Scenario List tab.
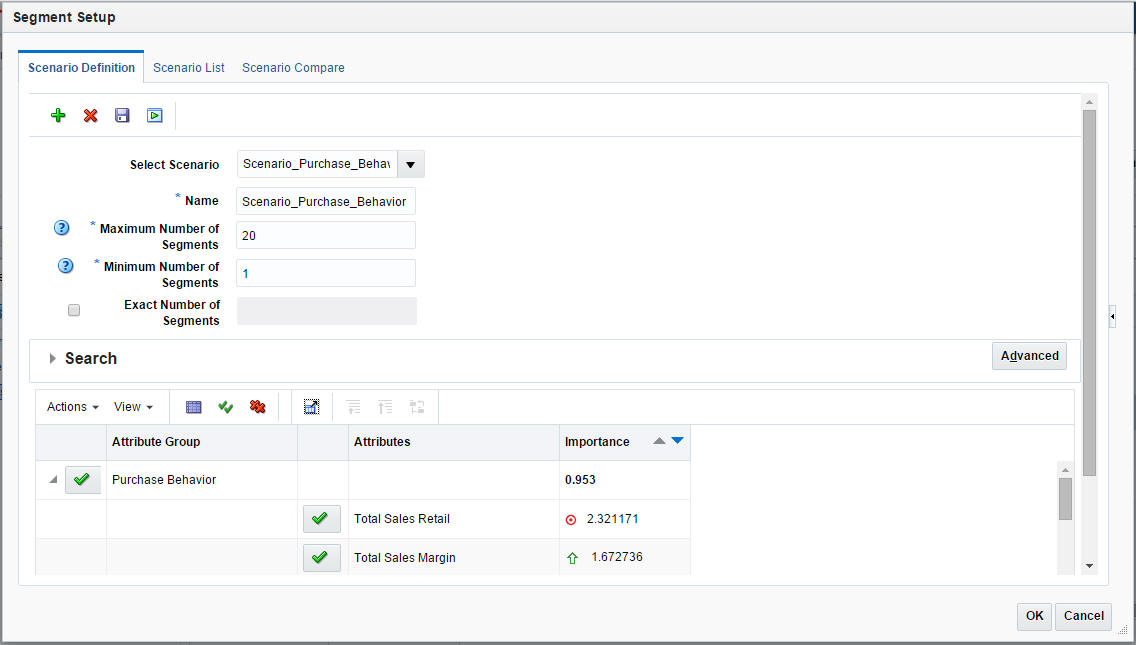
The following information defines a scenario.
Table 5-16 Scenario Definition
| Field Name | Description |
|---|---|
|
Select Scenario |
Select an existing scenario if you want to modify it. |
|
Name |
A unique name that identifies the scenario being defined. |
|
Max. # of Segments |
Set the maximum number for the total number of segments that can be generated. The application determines the optimal number of segments during the generation process. |
|
Min. # of Segments |
Set the minimum number for the total number of segments that can be generated. The application determines the optimal number of segments during the generation process. |
|
Exact # of Segments |
Indicates that the exact number of segments should be generated. The application does not determine the optimal number of segments. |
Attributes
The Attributes table is used to define which attributes are included in the segment criteria. You can
search by attribute, attribute value, or attribute importance
select and deselect attributes
The following information defines the attributes that are participating or non-participating.
Table 5-17 Attributes
| Field Name | Description |
|---|---|
|
Participating |
A check in this column indicates that the attribute participates in the segment criteria. |
|
Attribute Group |
A logical grouping of attributes such as demographics or purchase behavior. |
|
Attributes |
Attributes that are potential candidates for generating segments. |
|
Importance |
System-generated attribute importance index that indicates the significance of each attribute. |
The Attributes toolbar includes the following functionality:
Table 5-18 Attribute Toolbar
| Function | Description |
|---|---|
|
Action menu |
Resets the attribute selection to the default selection that system identified using attribute importance thresholds. |
|
Include or exclude attributes |
Any attribute beyond a certain threshold is not included in the segmentation process. |
Contextual Area
The contextual business intelligence lists a set of attributes that the current scenario includes as the participating attributes for the segmentation process.
Figure 5-19 Scenario Definition: Contextual Area
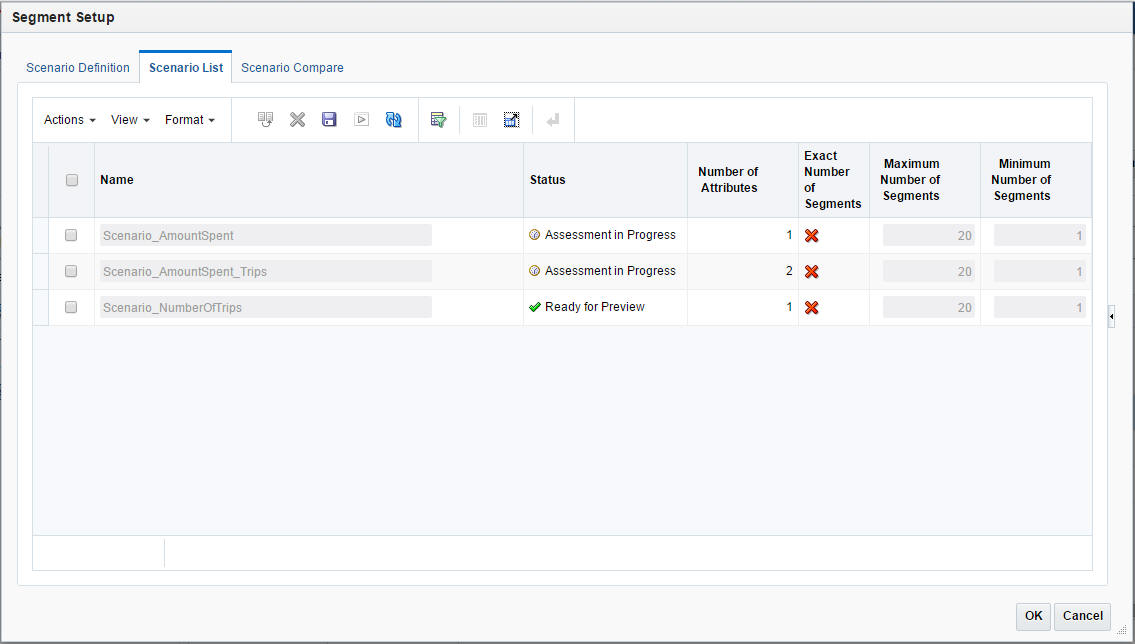
The Scenario List summarizes the characteristics for each scenario.
You can make a copy of a specific scenario in order to modify it in some way, delete a specific scenario, execute a specific scenario, or save a specific scenario. You can also refresh the scenario list in order to view the updated scenario status.
Table 5-19 Scenario List
| Field Name | Description |
|---|---|
|
Name |
The unique name that identifies the scenario. |
|
Status |
These include Created, Ready for Preview, Ready for Approval, Completed with Errors, Approved, Rejected. |
|
# of Attributes |
The number of attributes is defined by the Segment by option you select. |
|
Max. # of Segments |
If you provided a value for this in the scenario definition, that number is displayed here. |
|
Min. # of Segments |
If you provided a value for this in the scenario definition, that number is displayed here. |
After you select a scenario and execute it, you can see the results in this stage. The application uses the data and the parameters you defined in order to group customers together that are most similar according to the characteristics you selected and to separate customers that are most dissimilar. You can also use this stage to rename a segment.
Process
You use this stage to review segments and their composition, using the grid view and the graph view. This includes
Review a segment to see the goodness of fit by using the scores. Determine if any segments are outliers that warrant further analysis.
Rank the scenarios (segment sets) to see how well they are separated and how compact the customers are within each segment.
View the optimality of the segments recommended by the application to determine if increasing the number of segments beyond the optimal number is significant.
Rename the segment after analyzing the centroids and before the segment is approved.
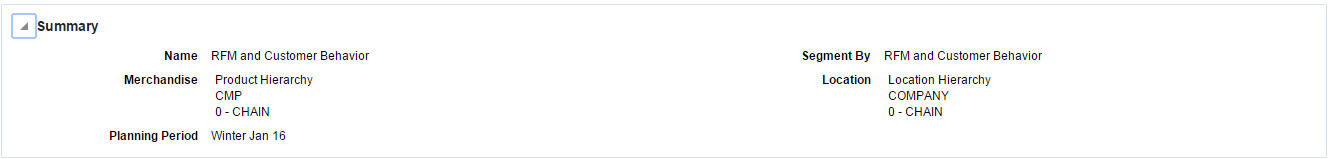
This lists the criteria you initially selected to define the segment.
Table 5-20 Segment Criteria Summary
| Field | Description |
|---|---|
|
Name |
The name you provided for the segment in the Segment Criteria stage. |
|
Segment By |
A predefined group of attributes that include Customer Demographics, RFM and Customer Behavior, and Category Purchase Driven. These criteria types are sets of attributes. For example, customer demographics are the properties of a customer. These properties can include ethnicity, income, and age. |
|
Merchandise |
The merchandise level and nodes for the segment. |
|
Location |
The location level and nodes for the segment. |
|
Fiscal Period |
The time period for the segment. |
|
Merchandise Hierarchy Type |
Provides details about which type of hierarchy the segment criteria have been created for. |
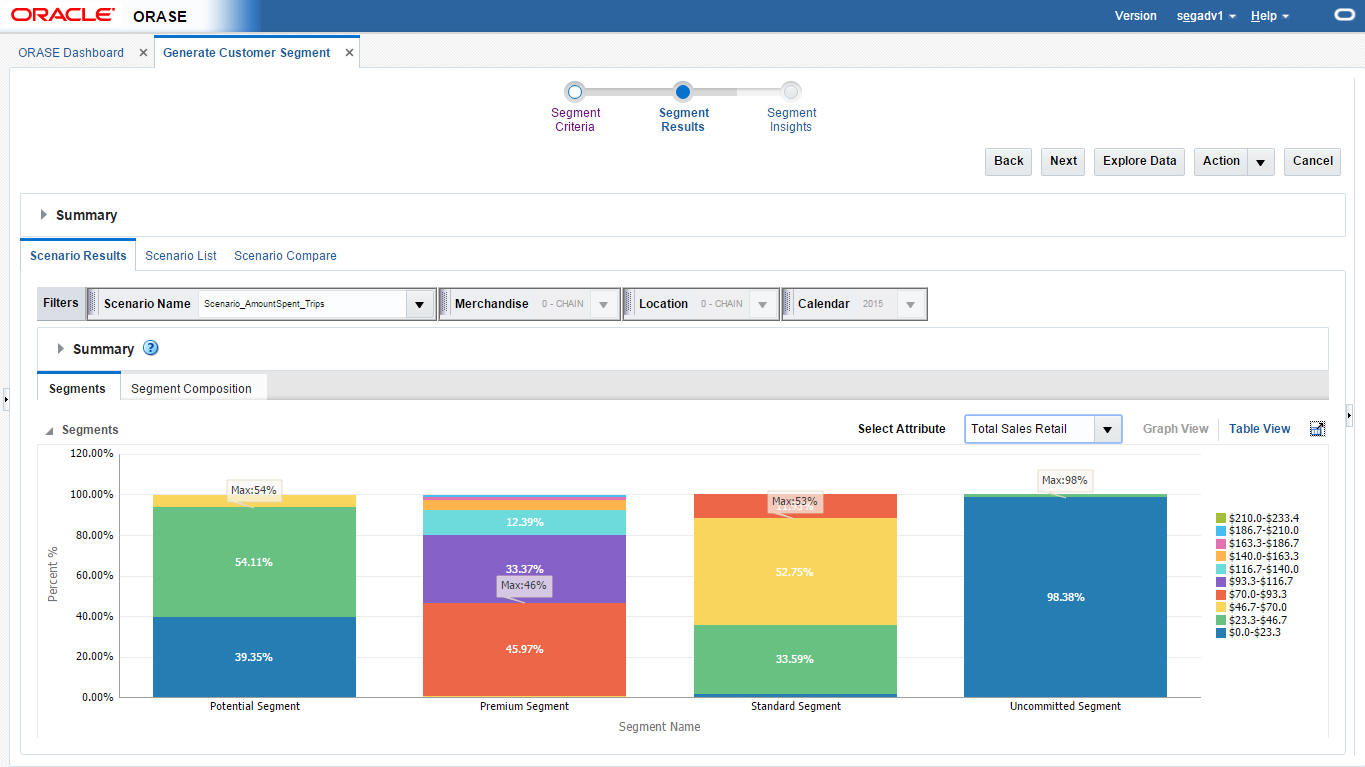
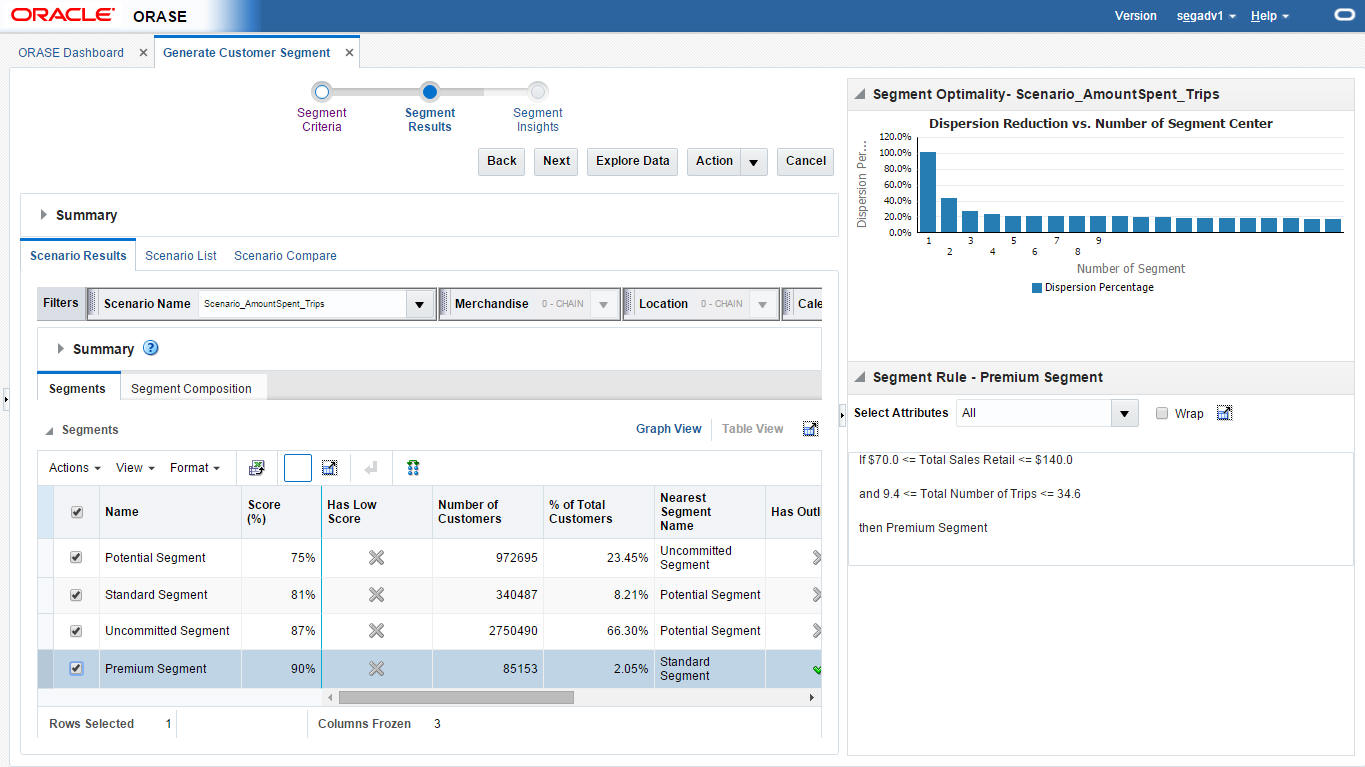
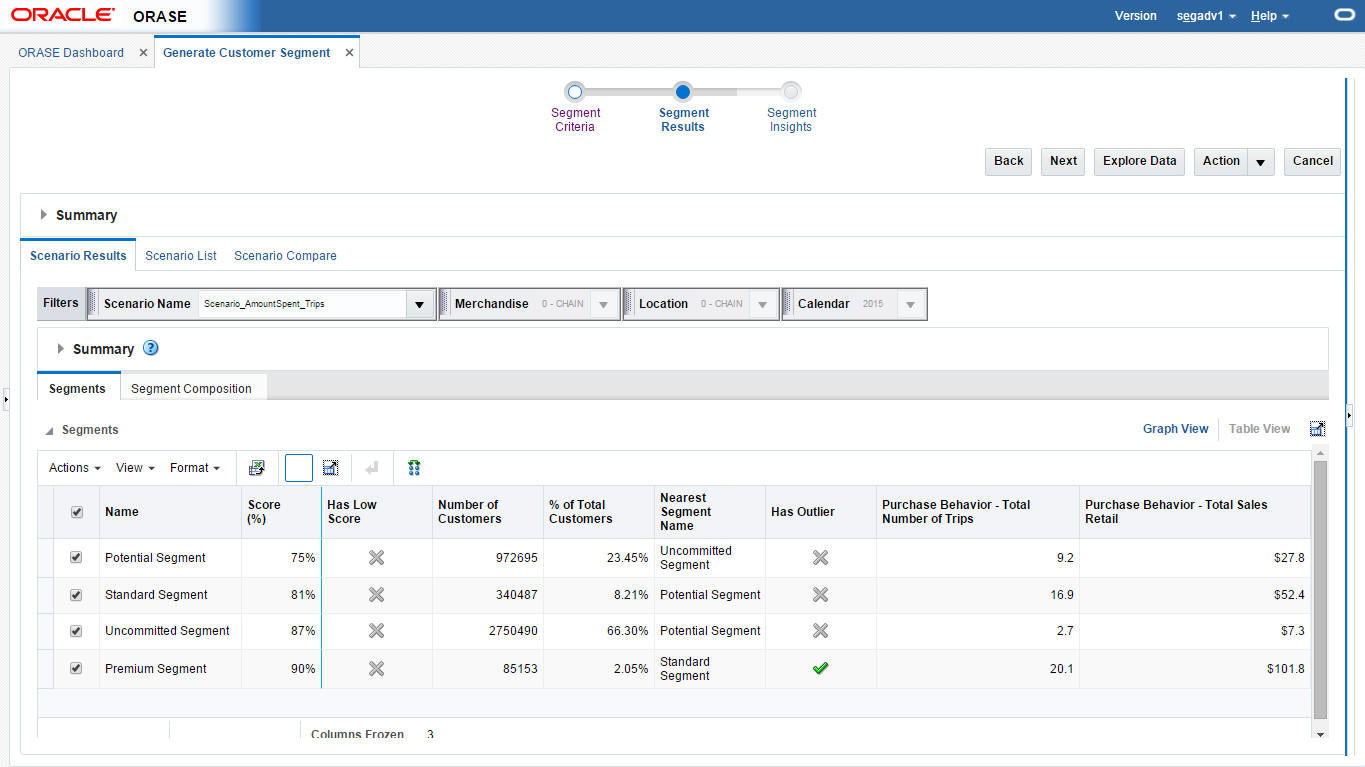
The Scenario Results section displays the following:
The Scenario Summary, which provides key segment set attributes for the executed scenario as well as its status.
The Scenario Results, which has two tabs: Segments and Segment Composition.
Figure 5-23 Customer Segmentation Scenario Results
The Summary section provides an overview of the characteristics of the scenario.
Table 5-21 Scenario Results Summary
| Field | Description |
|---|---|
|
Status |
Ready for Preview, Ready for Approval, Approved, Rejected. |
|
Optimal # of Segments |
The optimal number of segments determined by the optimization. |
|
Rank |
The application compares executed scenarios and ranks them. A value of 1 indicates the best scenario. |
|
Max./Min # of Segments |
The number you provided for the maximum and minimum number of segments to calculated. |
|
Largest/Smallest Segment |
Provides the sizes of the largest segment and the smallest segment in order to show the range of values. |
|
Is System Preferred |
Indicates whether or not the system prefers the scenario. |
|
Is User Preferred |
Indicates whether or not the user prefers the scenario. |
The Segments section provides the segment results for each individual segment in the scenario in either a Graph View or a Table View. The attributes displayed depend on the Segment by option chosen in the Segment Criteria stage.
The Graph View shows the percentage for each attribute in the segment.
The Table View provides details that can help you analyze the segment.
Table 5-22 Scenario Results - Segments: Table View
| Field | Description |
|---|---|
|
Name |
The name you assigned to the segment. |
|
# of Customers |
The number of customers in the segment. |
|
% of Total Customers |
The percentage of the total customers that the number of customers represents. |
|
Nearest Segment Name |
The name of the segment that is most similar to this segment. |
|
Score % |
This value is calculated at the level of customer and then averaged to the segment. The probability, expressed as a percent, of a customer being present in this segment rather than any of the other segments. See Segment Scores. |
|
Has Outlier |
Indicates a segment with the number of customers below a threshold. For example, the number of customers are below certain percentage of the number of customers in a segment. See Outlier Indicator. |
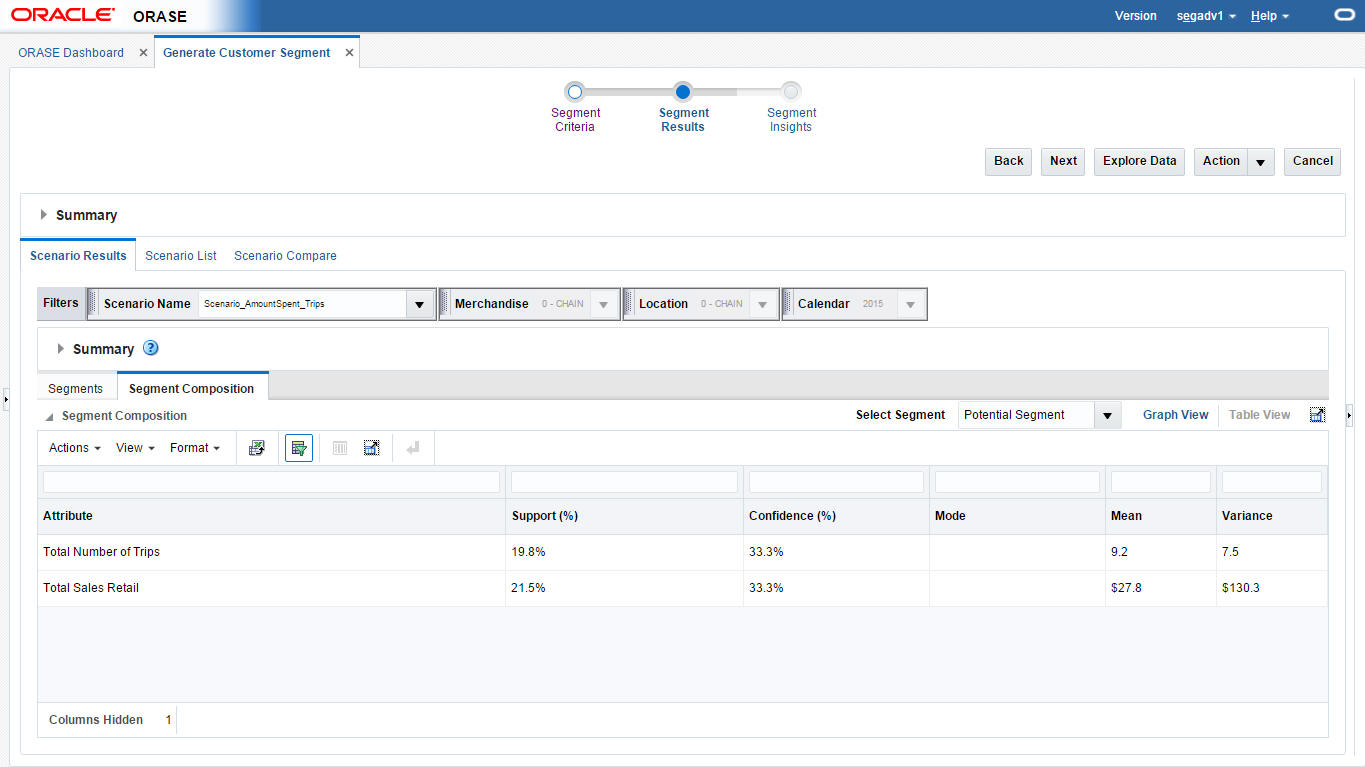
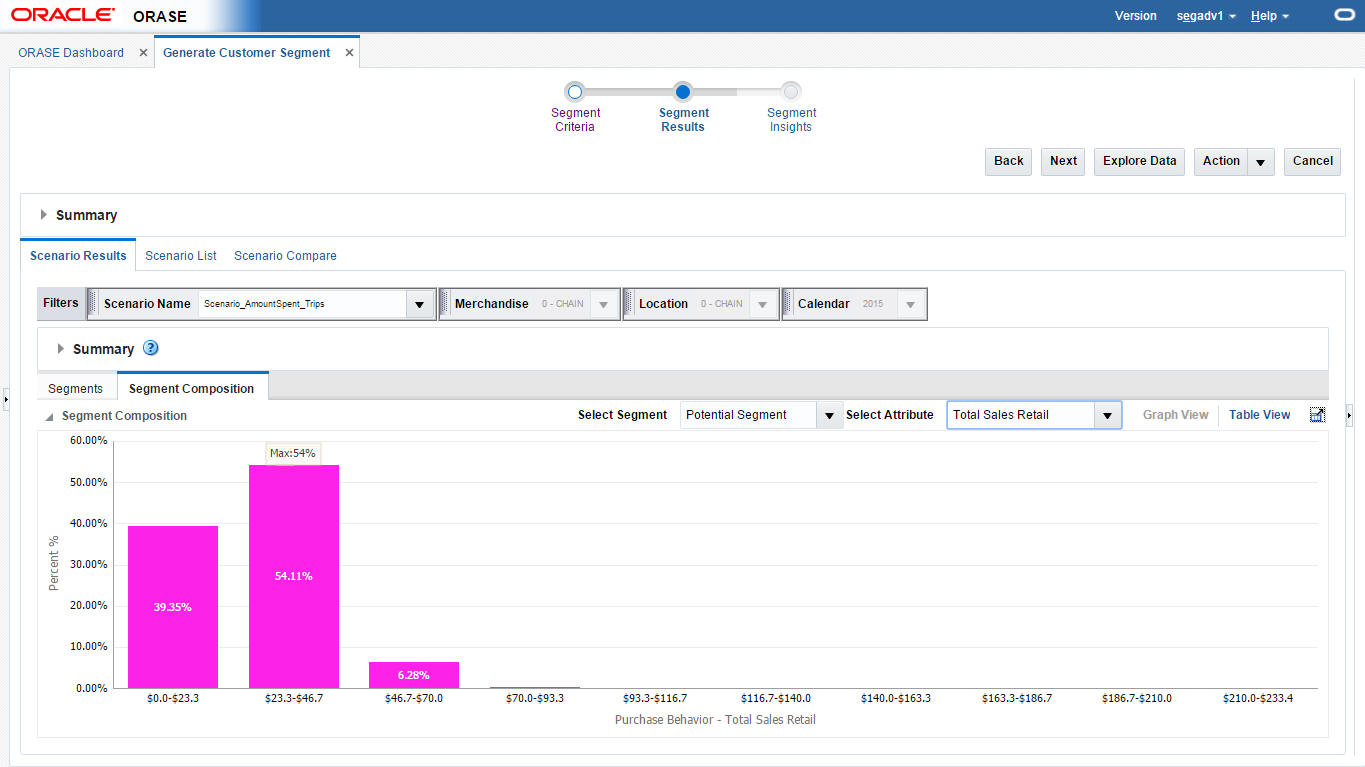
The Segment Composition sub-tab breaks down the segment into its component parts and shows the percentages for each attribute.
The Table View shows attributes, their confidence, and summary statistics within each segment.
Table 5-23 Segments Composition Table View
| Field | Description |
|---|---|
|
Attribute |
The name of the attribute that was used in generating the segment. |
|
Category |
The category name, which is only available for Category Purchase Driven segment by. |
|
Support |
The percentage of the customers that are concentrated within the segment according to the attribute. |
|
Confidence |
Measures the goodness of match between the distribution of the data points for the attribute, indicating the power in recognizing a new pattern in data. An attribute with a higher confidence number plays a more important role in that segment. |
|
Mean |
The average value of the numeric attribute within the selected segment. If no value is available, this is empty. |
|
Mode |
The most common value of the discrete attributes within the selected segment. If no value is available, this is empty. |
|
Variance |
This explains the dispersion from the average for the numeric attributes within the selected segment. If no value is available, this is empty. |
The Graph View shows the segment composition by attribute.
Figure 5-26 Segment Composition Graph View
The Scenario List section contains one table with details about each segment. Here, you can evaluate KPIs and approve or reject a segment.
Figure 5-27 Segment Results Scenario List
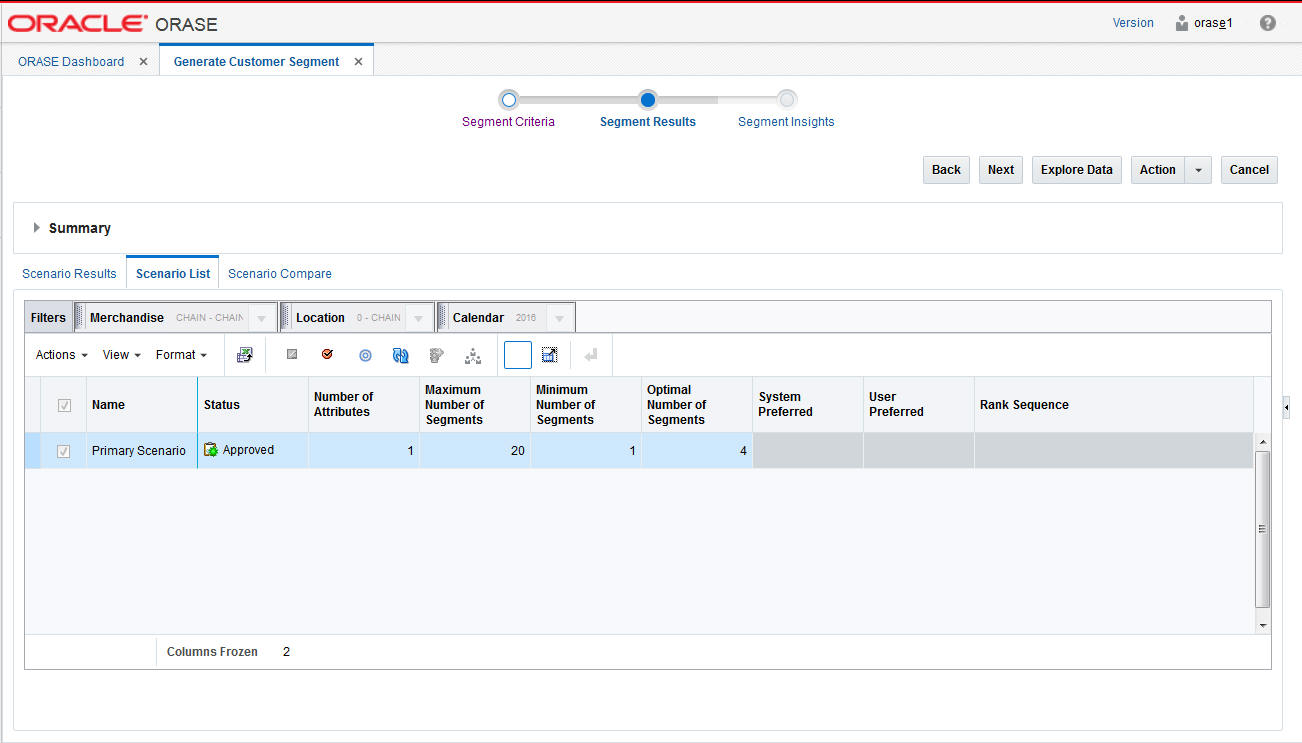
After a segment is approved, it is available for other applications.
Table 5-24 Scenario List
| Field | Description |
|---|---|
|
Name |
Name assigned to the scenario. |
|
Status |
Ready for Preview, Ready for Approval, Approved, Rejected. |
|
# of Attributes |
The total number of attributes used in the segmentation process. |
|
Max. # of Segments |
The value used for the maximum in the scenario execution, if this option used. |
|
Min. # of Segments |
The value used for the minimum in the scenario execution, if this option used. |
|
Optimal # of Segments |
The value used for the optimal number of segments in the scenario execution, if this option used. |
|
System Preferred |
Indicates whether the scenario is the one the application prefers. |
|
User Preferred |
Indicates whether the scenario is one the user prefers. |
|
Rank Sequence |
Indicates the ranking the scenario is given by the application. |
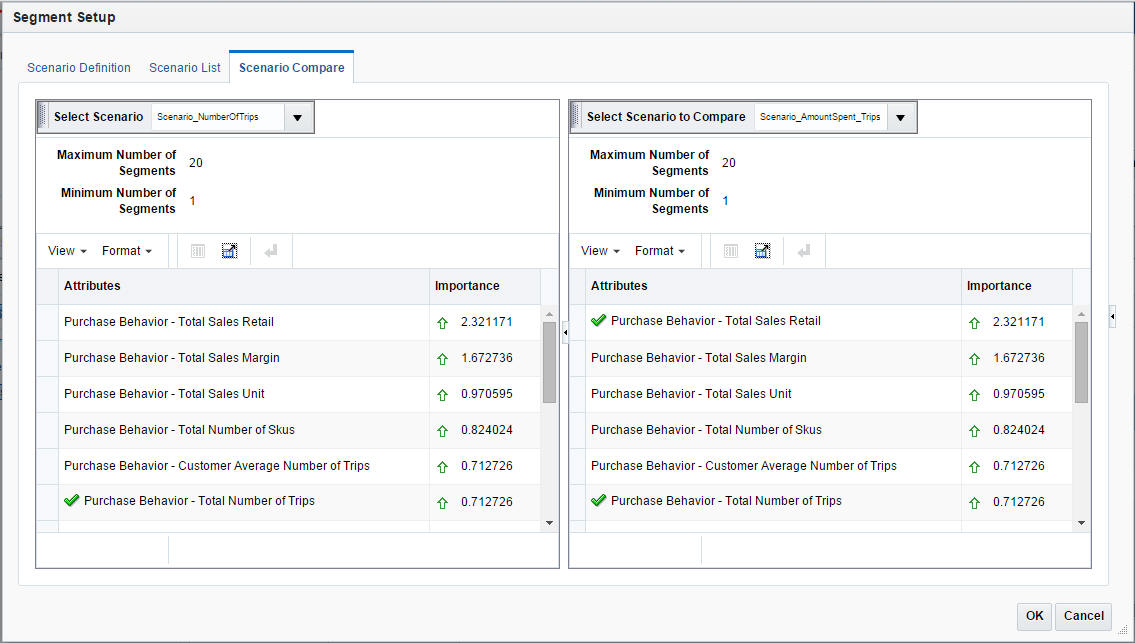
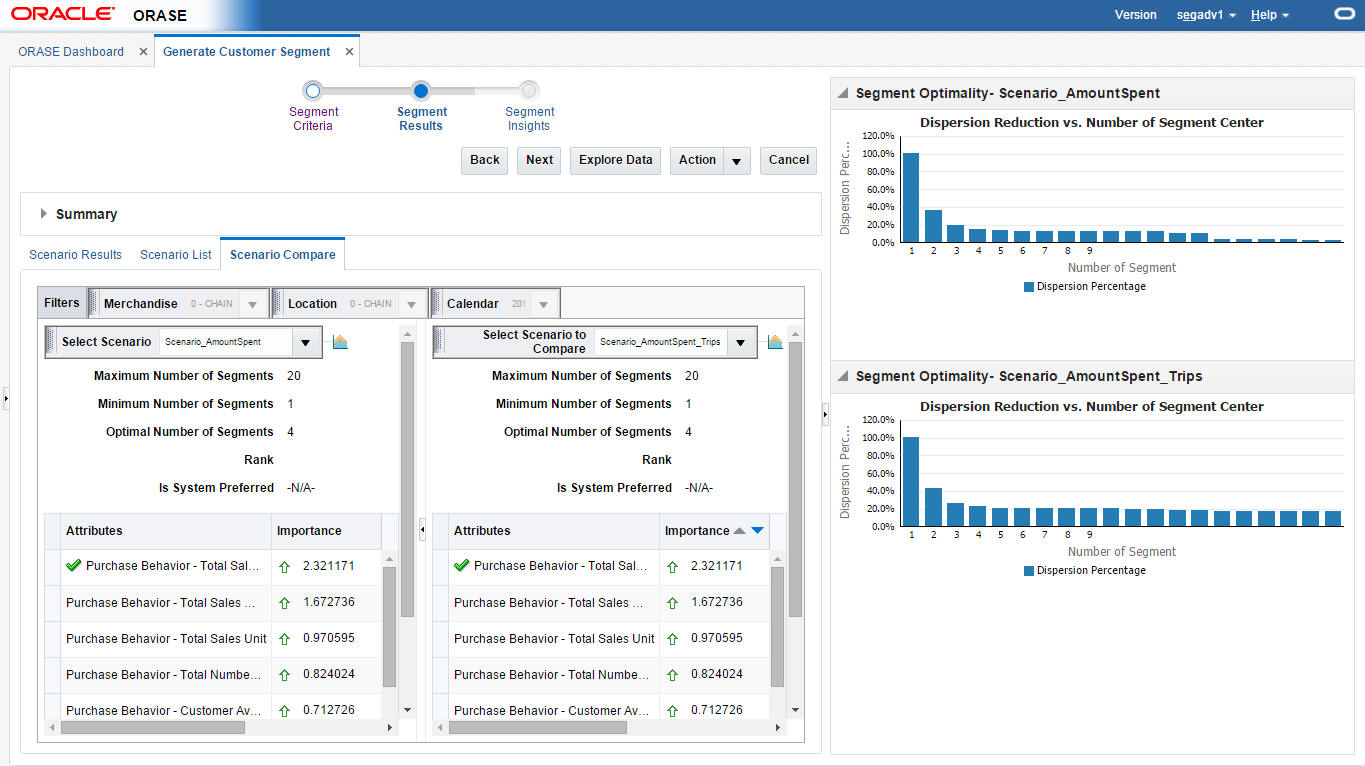
The Scenario Compare section shows two clusters of your choosing side by side so that you can compare the segment results of each, using the same characteristics used in Scenario Results and Scenario List.
Figure 5-28 Segment Results Scenario Compare
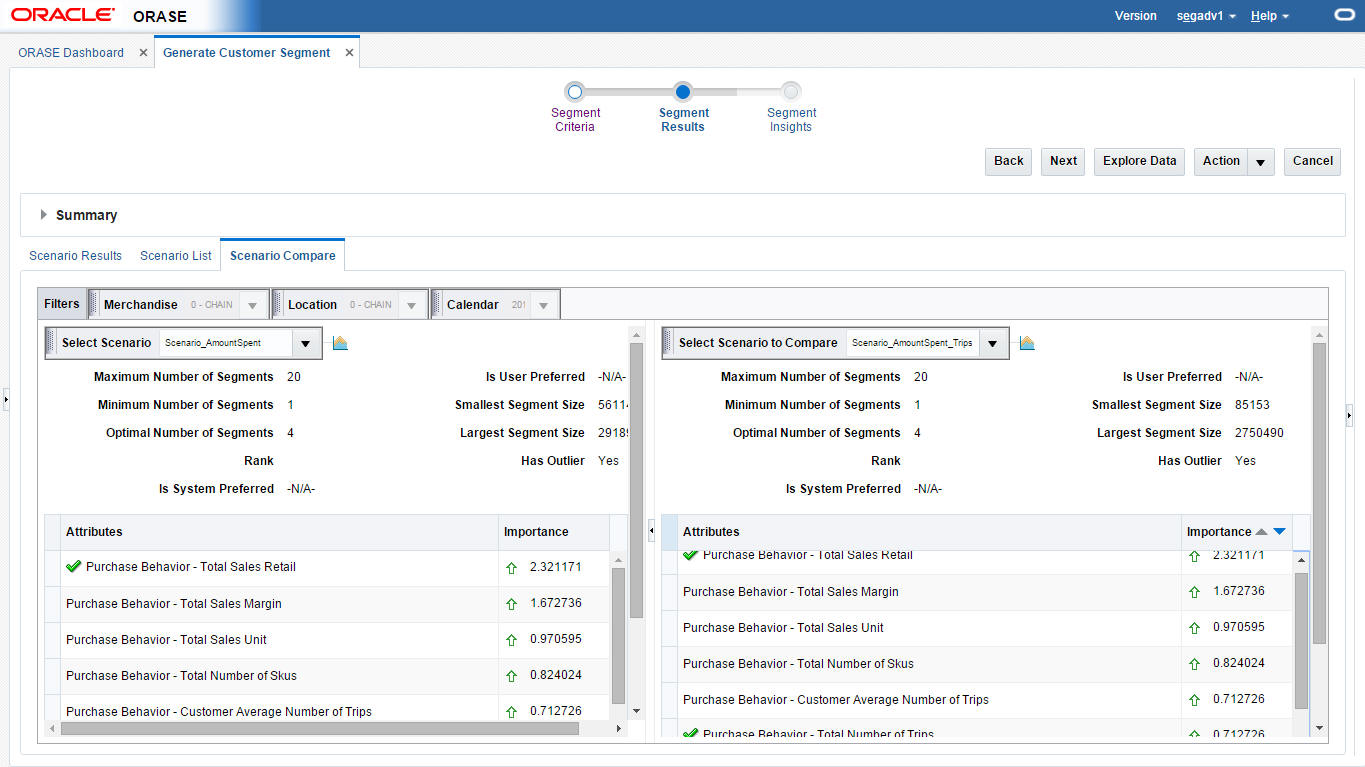
The information displayed includes:
Table 5-25 Scenario Compare
| Field Name | Description |
|---|---|
|
Max. # of Segments |
The value used for the maximum in the scenario execution, if this option used. |
|
Min. # of Segments |
The value used for the minimum in the scenario execution, if this option used. |
|
Optimal # of Segments |
The value used for the optimal number of segments in the scenario execution, if this option used. |
|
Rank |
The value for the rank. |
|
Is System Preferred |
Indicates whether the scenario is the one the application prefers. |
|
Is User Preferred |
Indicates whether the scenario is the one the user prefers. |
|
Smallest Segment Size |
The size of the smallest segment. |
|
Largest Segment Size |
The size of the largest segment. |
|
Has Outlier |
Indicates a segment with the number of customers below a threshold. For example, the number of customers are below a certain percentage of the number of customers in a segment. |
|
Attributes |
A list of relevant attributes. |
The application provides the following recommendations at the scenario (segment set), segment, and customer levels.
This graph indicates how the system identifies the best number of segments for a given data set. It starts with a small number of segment centers and searches for the number beyond which there is minimal dispersion. At this point, increasing the number of segment centers any more only reduces dispersion by a small amount, and the marginal improvement is small.
You can see the ranking of all scenarios in the Segment Results step. The scenario with the highest rank is designated as System Preferred. The ranking is based on the following:
How many similar customers are contained in the segment.
How well separated the segments are from each other.
The rank for a scenario is calculated by taking the average of the probability of all the data points in that scenario. A higher probability value for a customer is an indication of the goodness of fit of the segment.
This provides an outlier indicator in the segment list if the segment has an outlier customer. Two outlier rules are supported. The distance from the centroid indicates that if a customer is beyond a certain limit for the configuration threshold from the centroid, then the segment to which the customer belongs is marked as an outlier. When the size of a segment is compared with the total customers, if the number of customers in the segment is below a certain configured percentage of the total customers, then the segment is marked as an outlier. The distance from the centroid is the outlier rule that is configured by default.
Segment rules describe the data in each segment where most of the data is concentrated. A rule is a conditional statement that captures the logic of how the system generates the hierarchy of segments and what conditions it uses for further splitting a segment. Each rule describes the conditions for a customer to be assigned with some probability to a segment. Figure 5-30 provides an example of rules.
The application provides scores for segments, based on the threshold score. The scoring measure the goodness of a segment. A score for a particular segment is calculated using the average of the probability scores of the customers in a segment. The score is based on the assumption that each customer has an equal chance of being a member of the segment. A high score indicates that the customer is close to the centroid. A low score indicates that the customer is an outlier. The low score indicator is turned on and off.
Customer Segmentation supports periodic processing rules in order to allocate customers who are new. If a customer over time has built enough sales history, the system begins to consider customers and allocates them to segments based on the probability scores.
This allows the user to calculate the sales share of customer segments for each store. These store profiles can be generated by the user from the user interface for the approved customer segments. The store profiles can then be consumed by RI or a subscribing application to be used in generating business reports. The profiles are also consumed in Advanced Store Clustering and used to generate customer-centric store clusters.
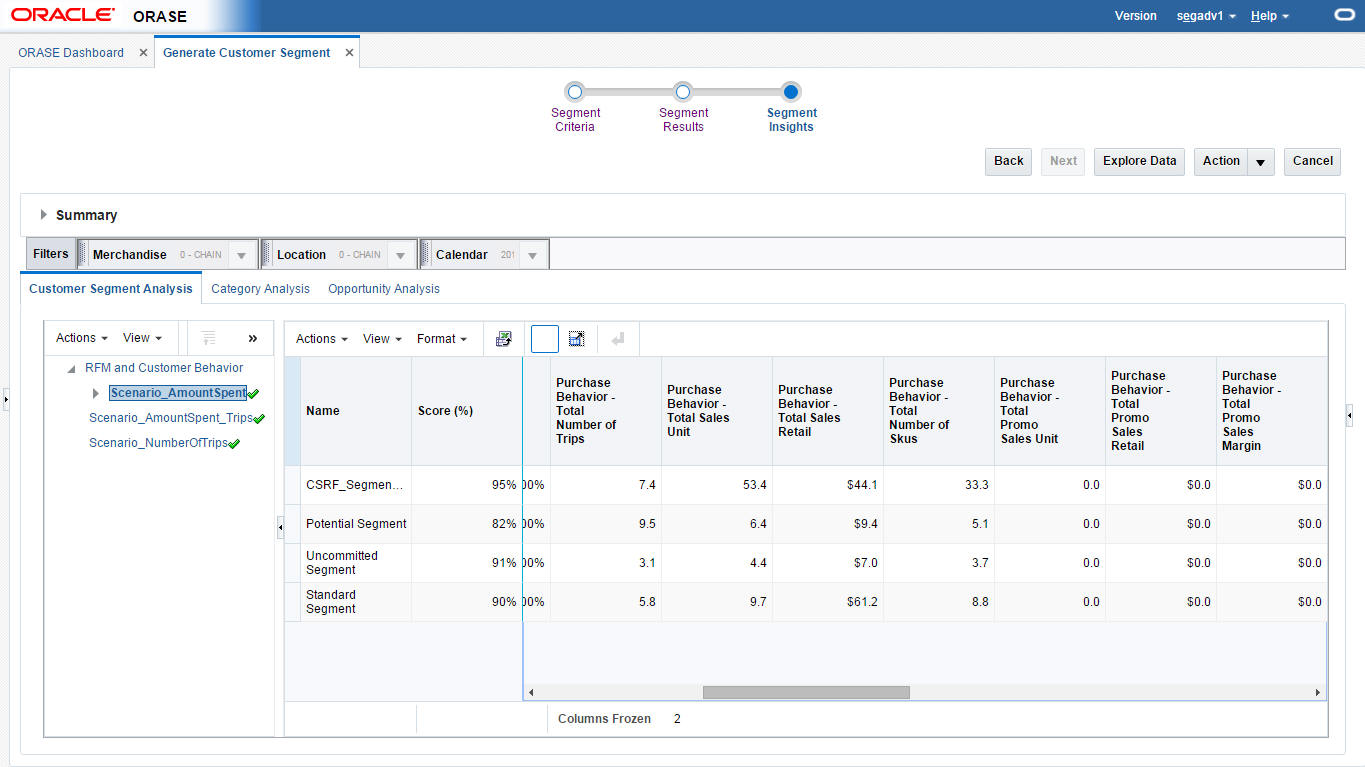
Use the Insights stage to analyze a scenario, its segments, and its hierarchy, based on performance and attribute contributions, prior to the approval of the scenario. This stage includes the following tabs:
Customer Segment Analysis
Category Analysis
Opportunity Analysis
The Customer Segment Analysis tab lists all the scenarios, the customer segments for each scenario, and the related KPIs. Aggregates (mean and mode) of the attributes are displayed for each segment. The attributes by default are included in the grids customer purchase behavior and customer demographics.
This tab includes the following tasks:
Evaluate the KPIs for a scenario, it this has not been completed earlier
Approve a scenario
Rename segments within a scenario
Rank scenarios, if not completed earlier
Flag a segment scenario as system preferred
Generate store profile for an approved scenario
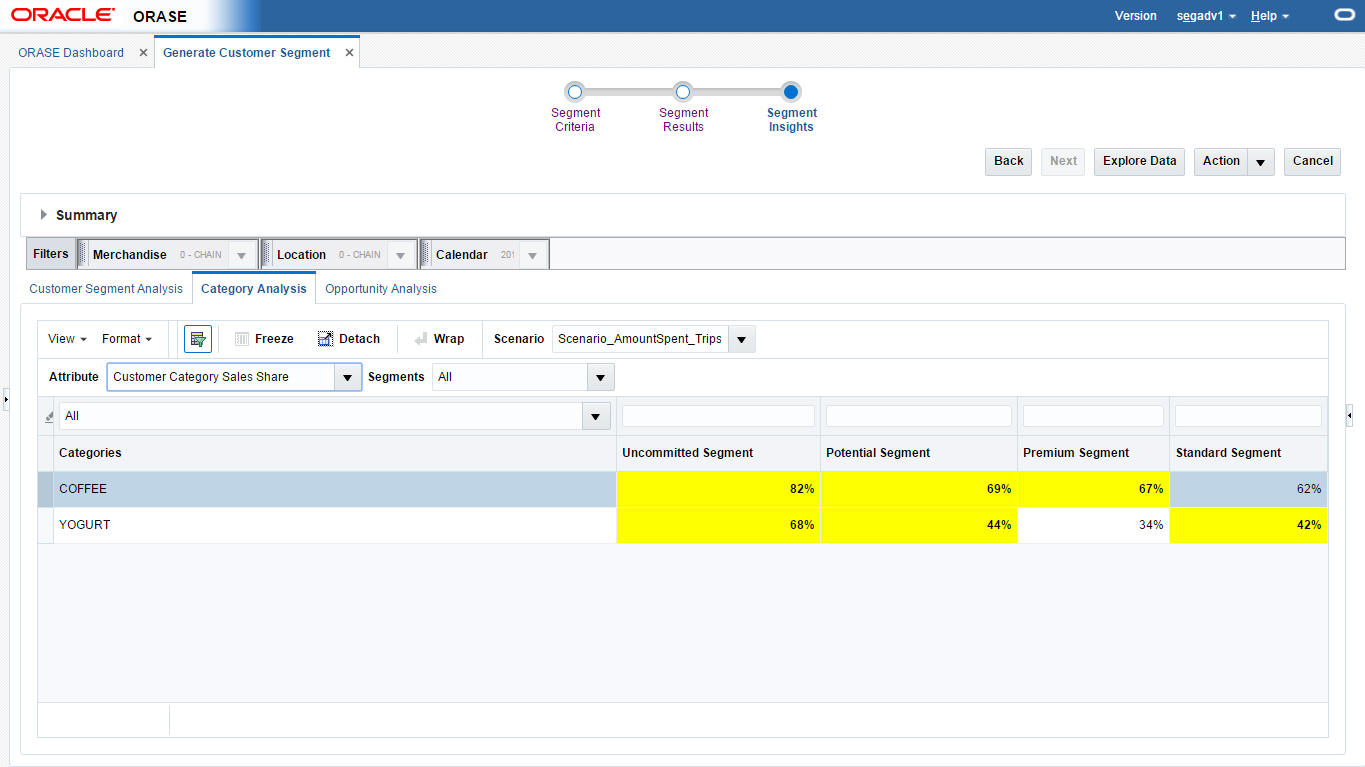
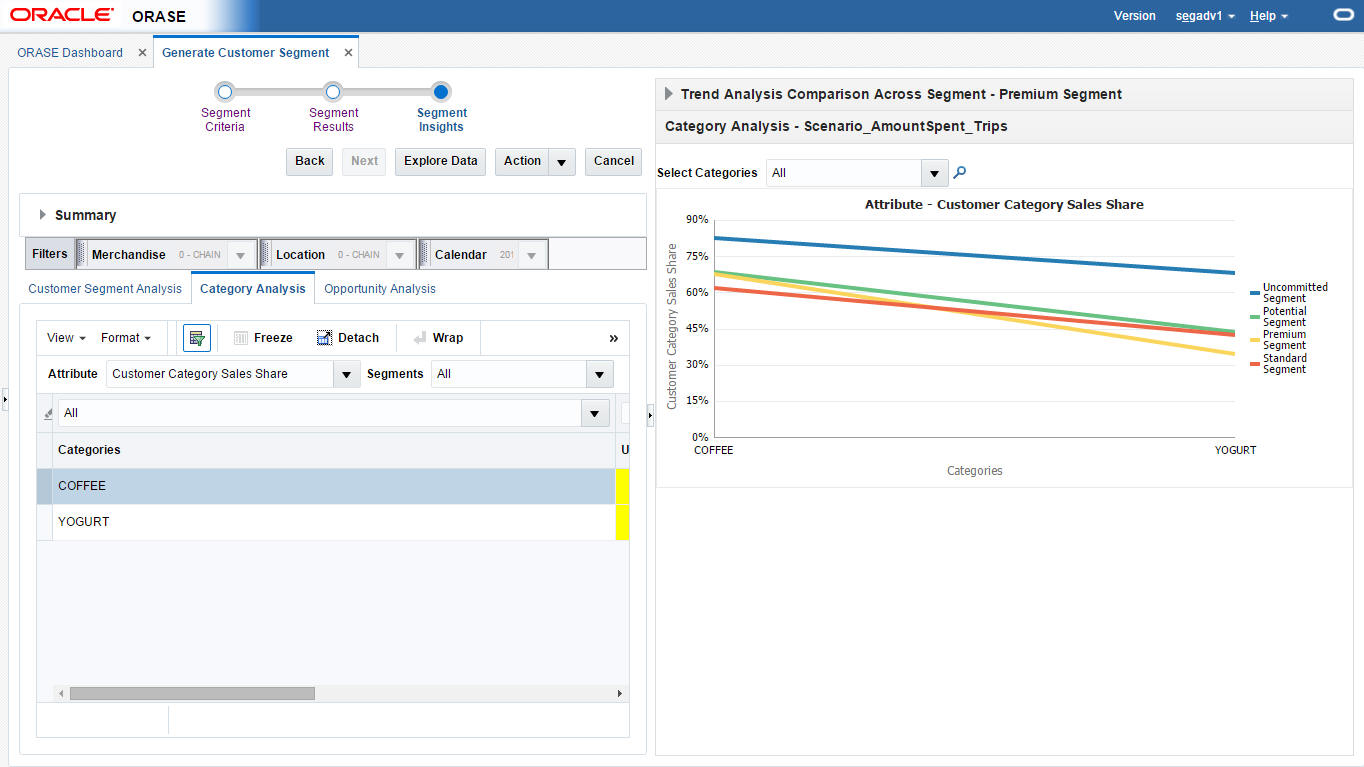
The Category Analysis tab lists the top categories vs. the customer segment matrix. You can analyze the segment performance in each category using different sets of attributes such as sales share or number of trips.
The system highlights the top three performing segments for each category, and you can compare category performance across segments. You can filter categories or select a set of segments while comparing the results.
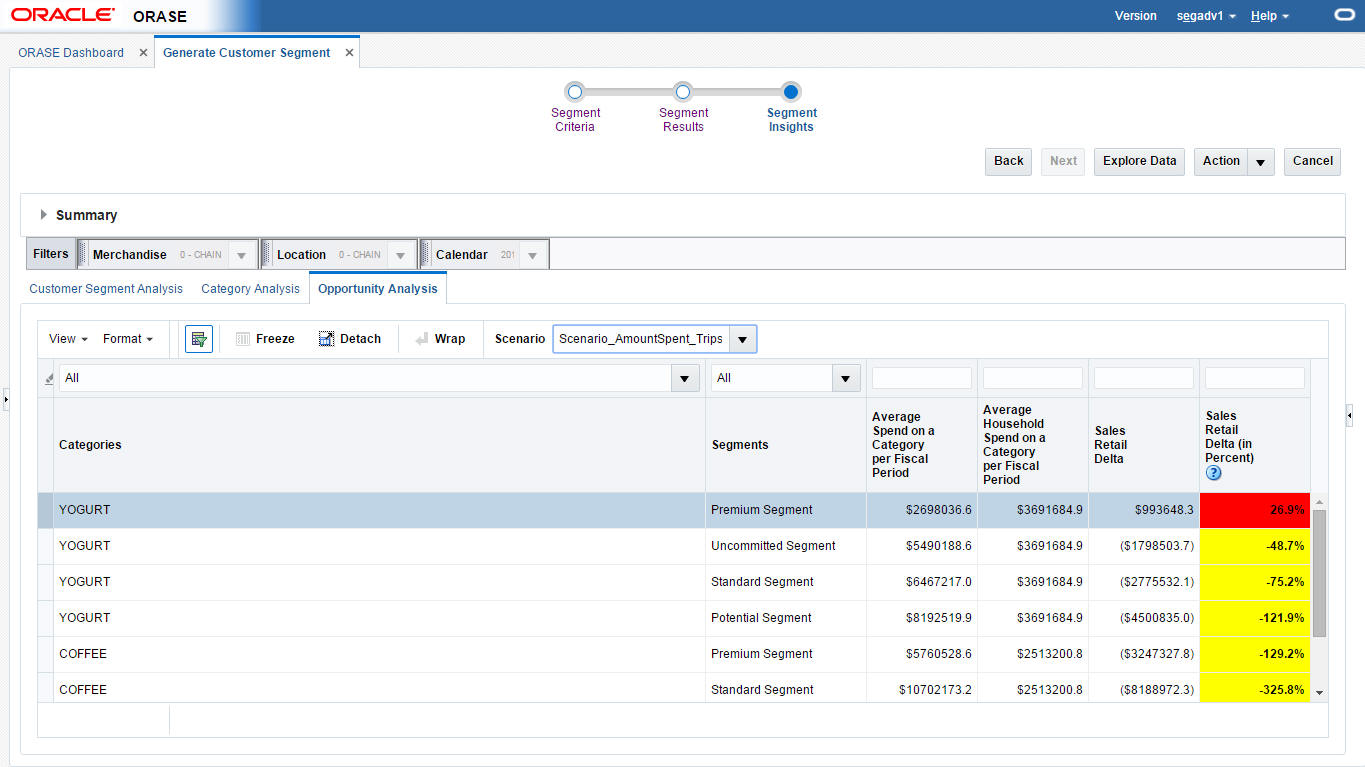
The Opportunity Analysis tab provides a comparison of the retailer to market data analysis for the category and provides an analysis about where there is an opportunity for the retailer to grow for each segment.
You can compare where the retailer is performing better by comparing the average sales retail spend per <configurable time period>.
Table 5-27 Opportunity Analysis
| Field Name | Description |
|---|---|
|
Segment |
The segments for the selected scenario. |
|
Category |
The top identified categories in the preprocessing. |
|
Average spend on a category per <configurable time period> |
The average amount spent for a segment. |
|
Average household spend on a category per <configurable time period> |
The average household amount spent for a segment. |
|
Sales retail delta |
The difference in sales retail between retailer and market data. |
|
Sales retail delta as a percent |
The percentage difference in sales retail between retailer and market data. |
The color indicators listed in the following table help you see if the difference in sales retail is above or below a certain threshold or within an acceptable range. This grid is sorted with the sales retail difference as negative or highlighted as red, so that you can review the values below threshold first.
| Color | Value |
|---|---|
| Red | X percent below |
| Green | Y percent above |
| Yellow | In between X below and Y above |
This grid provides a filter for customer segment and category, so that you can review the category for each segment or vice versa.
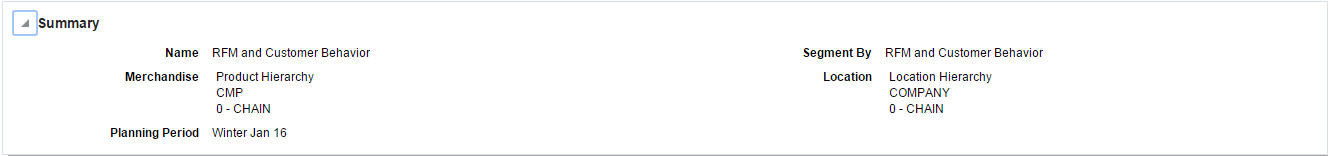
This lists the criteria you initially selected to define the segment.
Table 5-28 Summary
| Field Name | Description |
|---|---|
|
Name |
The name you provided for the segment in the Segment Criteria stage. |
|
Segment by |
A predefined group of attributes that include Customer Demographics, RFM and Customer Behavior, Category Purchase Driven. These criteria types are sets of attributes. For example, customer demographics are the properties of a customer. These properties can include ethnicity, income, and age. |
|
Merchandise |
The merchandise level and nodes for the segment. |
|
Location |
The location level and nodes for the segment. |
|
Fiscal period |
The time period for the segment. |
|
Merchandise hierarchy type |
This provides details about which type of hierarchy the segment criteria have been created for. |
This BI compares how segments vary by Gross Margin% (x axis), Average Amount Spent <per configuration period> (y axis), and Total Sales Retail (z axis) for the customer segment. This can help you understand which segments are underperforming and have the potential for growth. The segments in the middle of the chart are the segments that have growth potential, as compared to the premium segments to the top right.
Figure 5-35 Cross Segment Spend Analysis
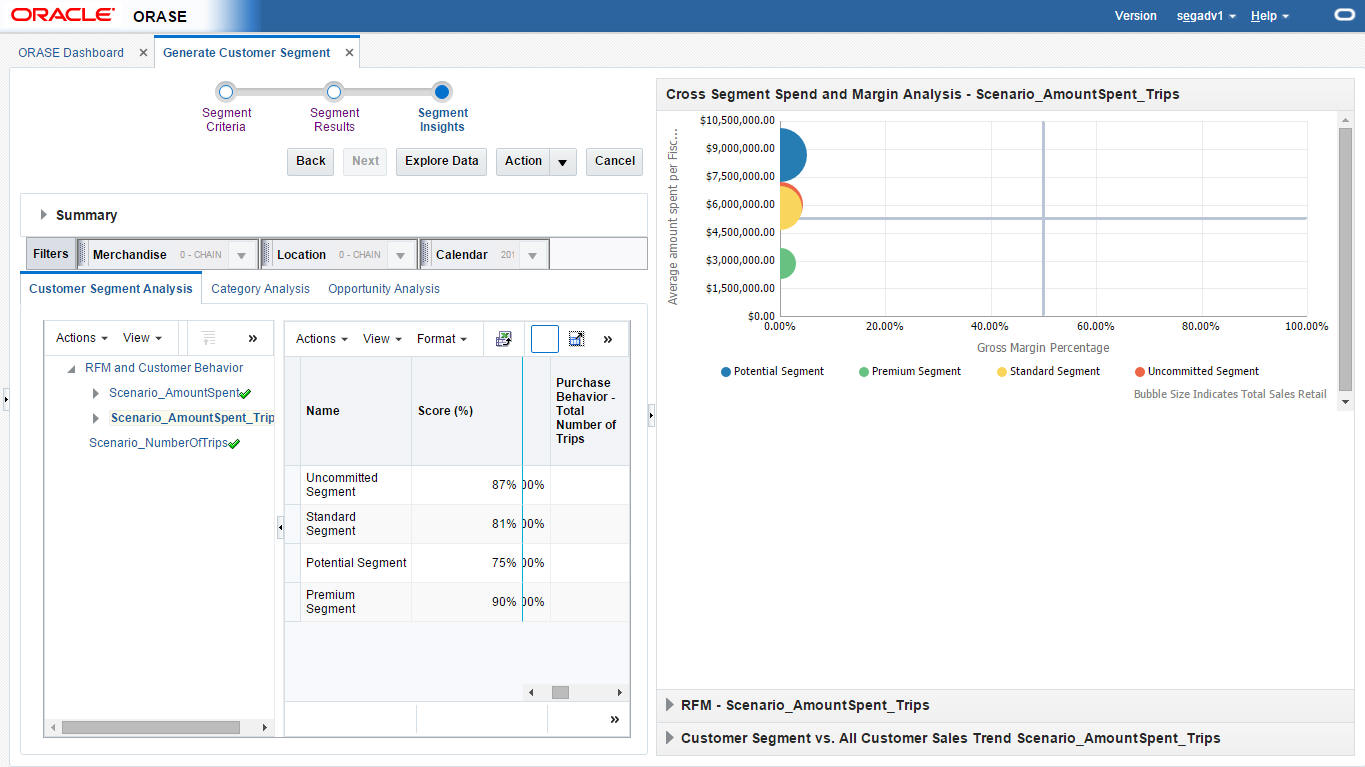
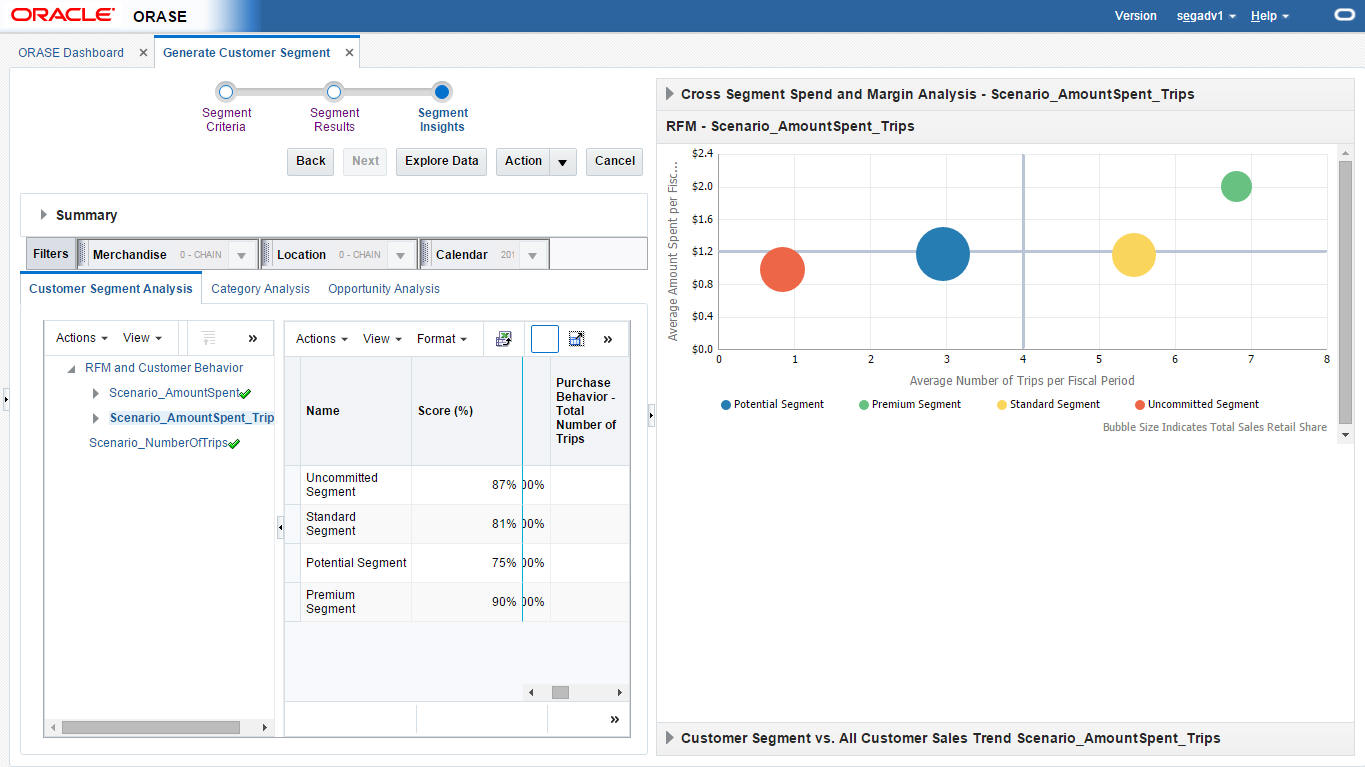
This BI provides analysis of segments based on frequency and amount spent. The more frequent customers tend to have a significantly better response and average spend than those who have shopped less recently or less frequently. This indicates customers that are high spender and frequent shoppers are premium segments, vs. low spender and infrequent shopper are uncommitted customers. Figure 5-36 shows how the premium customer segment is in the top right corner, the potential customer segments are close to the center, and the uncommitted shoppers are in the bottom left quadrant. This helps in planning how potential and uncommitted customers can be attracted by certain offers and how existing committed customers can be satisfied.
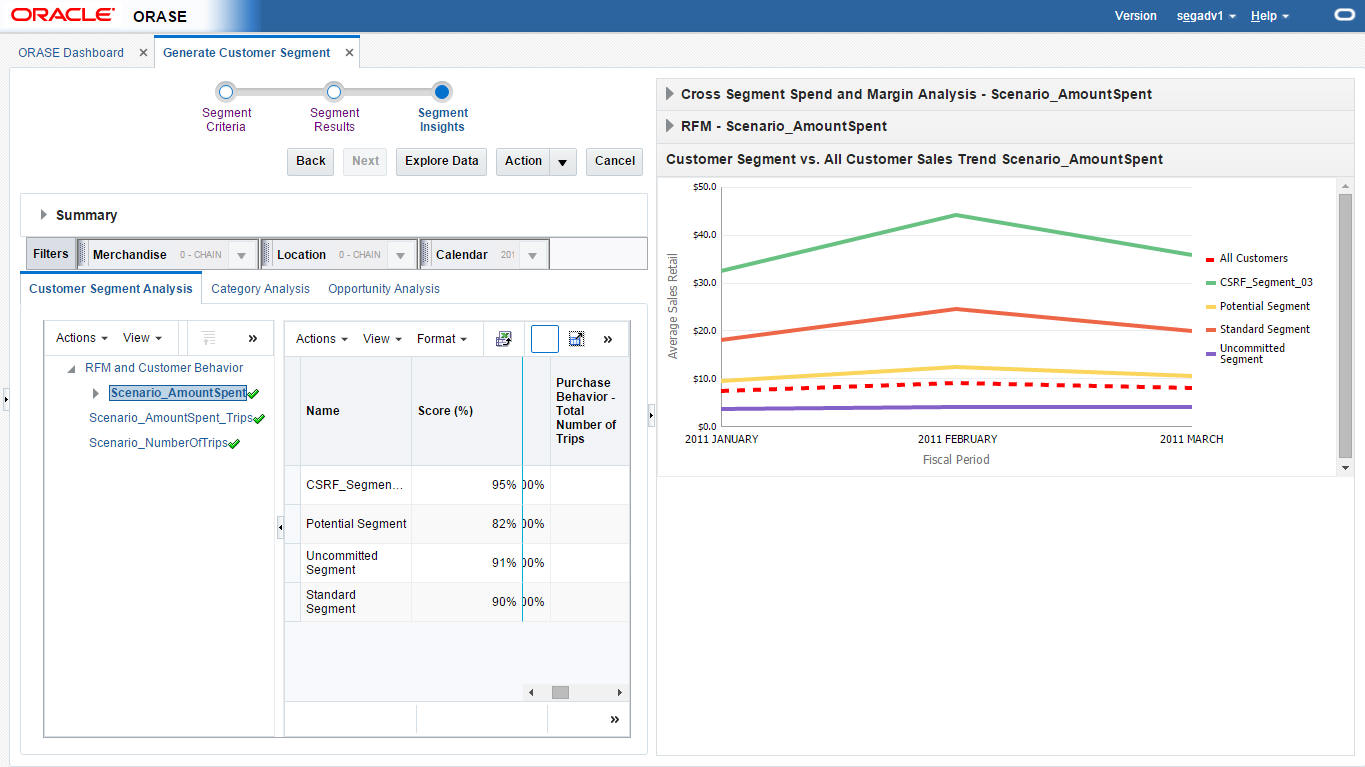
This BI shows a customer segment's sales trends by comparing Average Sales Retail per Segment vs. Average Sales Retail for all customers for the selected criteria time period. You can then see if sales retail has decreased for a specific customer segment and for which customer segment it has remained consistent for the defined quarters. This can help you determine if certain customers are migrating from one customer segment to another over the time period. Figure 5-37 shows how, for each segment, sales increased in 2011 February and the average sales of entire customer base, compared to the segments created.
Figure 5-37 Customer Segment vs. All Customer Sales Trends
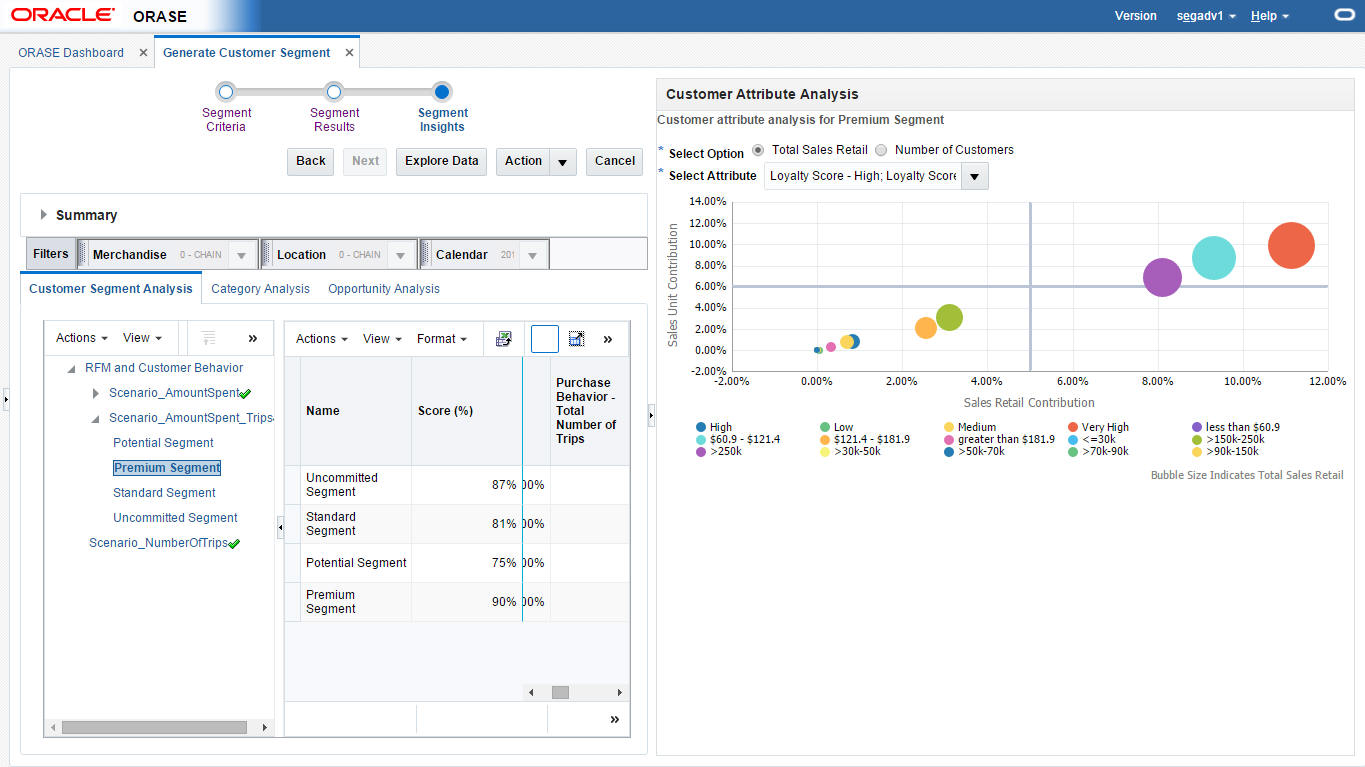
Customer attributes are analyzed and compared to identify the most prominent selling attributes within a segment. This indicates how the customer attributes are correlated and what each attribute in the specified segment contributes to sales. You can make inferences about which attributes in the segment contribute to significant sales and the potential attributes that should be considered for assortment planning in order to improve sales even more. This chart also provides you with the option to see the number of customers in each segment instead of total sales retail, thus providing insights about how many customers with certain attributes and attribute values are present in certain segments. Figure 5-38 shows how customers with high income and high loyalty score contribute to most of the sales in the segment.
The following properties are displayed by the graph. Note that the customer attributes are only displayed when they are configured as part of the Cluster by process.
Table 5-29 Properties
| Axis | Description |
|---|---|
|
x-axis |
Sales Retail $ contribution, calculated using the sales revenue share of each attribute in the segment with respect to the total segment sales revenue. |
|
y-axis |
Sales Unit $ contribution, calculated using the sales unit share of each attribute in the segment with respect to the total segment sales units |
|
z-axis |
Total Sales Retail $ or number of customers of each attribute in the selected segment, indicating, via the bubble, the magnitude of the sales contribution. |
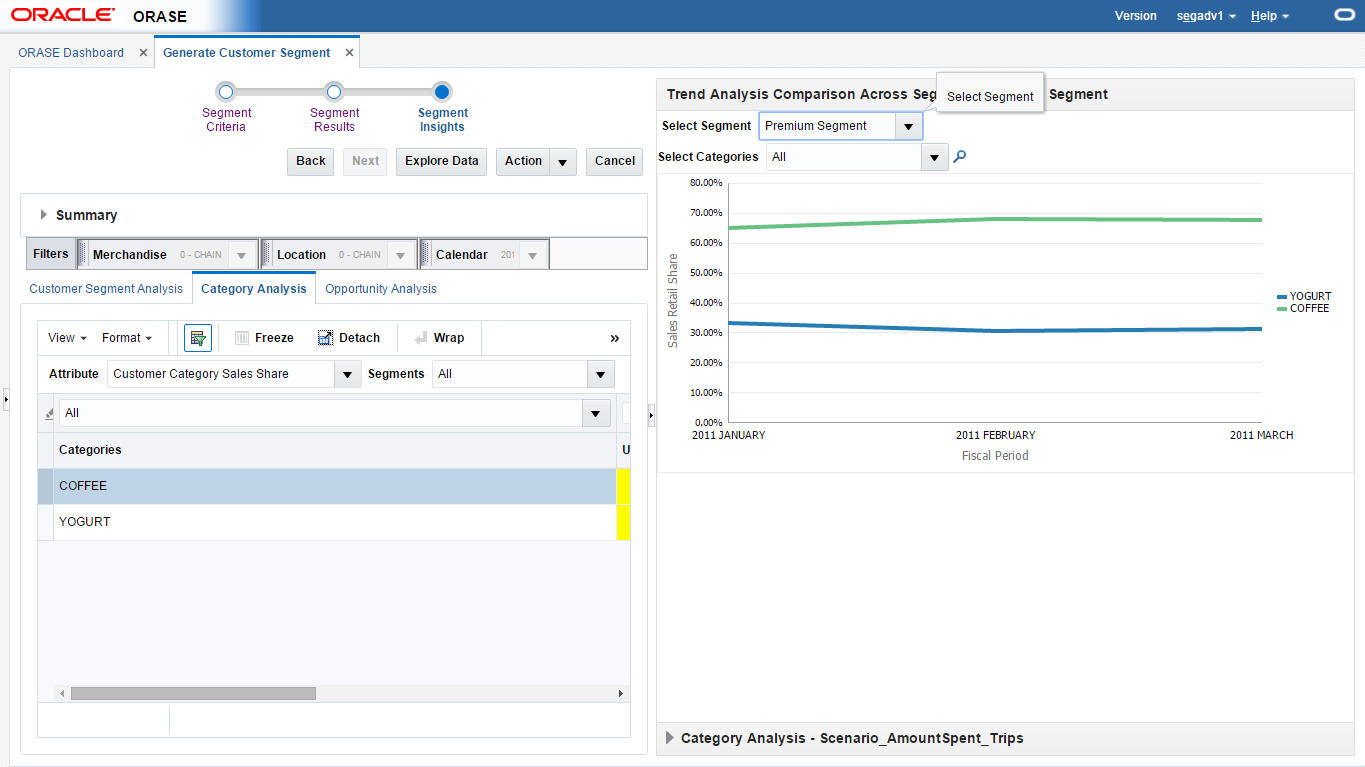
You can perform category/segment analysis by comparing categories using a selected attribute (such as category sales share, category promotion sales share, average amount spent per month, or number of trips). This can indicate the segments and categories that customers are shopping frequently.
This BI compares sales for selected categories in a segment. You can compare sales by <Configurable Period (Period or Quarter)> to view trends for each category. You can limit the number of categories by selecting a subset of the categories in the drop-down list. You can use this information to plan certain categories for certain seasons by comparing sales with previous periods or by modifying a category plan that is underperforming for a segment in a certain season. The time period displayed is driven by the selection you make in the Segment Criteria. If you select a source time period to include two years worth of data then you will also see the data for the previous year.