| Oracle® Retail Science Cloud Services User Guide Release 18.0.002 F17712-02 |
|

 Previous |
 Next |
Oracle Retail Assortment and Space Optimization Cloud Service is used to determine the optimal selection and arrangement of products within stores by optimizing the product assortment and product placement on a virtual planogram. It uses information about available space, product dimensions, expected demand, replenishment schedules, merchandising rules, fixture space, and category goals in order to create a virtual planogram that optimizes total performance. The products and product assortments that are selected for the virtual planograms are the ones that ASO Cloud Service recommends for the finalized assortment. The recommended product level data is used inside CMPO, while the virtual planograms created in ASO Cloud Service are also then available to be used in space planning.
It supports the following fixture types:
Shelves
Pegboards
Freezer chests
Shelf/pegboard combinations
Optimizations are run at either the Store level or at the Space Cluster level. Space Clusters are ad hoc groups of stores used for optimization. Each space cluster includes stores that are in the same assortment, have the same product list, and have the same current planogram length (or same POG length, height, and depth, if selected). Space clusters are typically a level between assortment cluster and store. ASO Cloud Service creates these groups by splitting stores from an assortment cluster into smaller groups of stores that have the same product list and the same current planogram length.
At a high level, ASO Cloud Service starts with an assortment that is ready for optimization. The assortment is mapped to one or more planograms, and one or more optimization runs occur. Approved runs are then available for assortment analysis and can then be finalized and exported.
This section provides information to help you understand the functionality of ASO.
For information about the administration of ASO Cloud Service, see Oracle Retail Science Cloud Services Administration Guide.
The following four user login roles are available:
Micro Space Optimization Analyst – main business user responsible for day-to-day micro-space optimization activities
Category Manager – product-assortment-centric user who is interested in viewing ASO results and in the translation of data between CMPO, Retail Analytics, and ASO
Administrator – responsible for general system setup and configuration tasks related to the business
Analytical Super User – responsible for analytical configuration, testing, and model diagnosis
Table 6-1 User Roles and Permissions
| Privilege | Data Access | Micro ASO Analyst | Category Manager | Administrator | Analytical Super User |
|---|---|---|---|---|---|
|
Create new ASO run |
All runs |
X |
X |
||
|
Modify existing ASO run |
Runs they created |
X |
X |
||
|
Modify the name and description of an existing ASO run. |
Runs they created |
X |
X |
||
|
View existing ASO run |
All runs |
X |
X |
X |
X |
|
Submit or re-submit ASO run |
Runs they created |
X |
X |
||
|
Runs they created with technical failures |
X |
X |
|||
|
Approve ASO runs |
Runs they created |
X |
|||
|
Delete saved ASO runs |
Runs they created |
X |
X |
||
|
All runs |
X |
||||
|
View list of saved ASO runs |
All runs |
X |
X |
X |
X |
|
View mapping of products to POG sets |
All assortments |
X |
X |
X |
X |
|
Modify mapping of products to POG sets |
All assortments |
X |
X |
||
|
Toggle assortment status between Ready for ASO and POG Mapping Needs Review |
All assortments |
X |
X |
||
|
View rules for mapping products in POG sets |
All assortments |
X |
X |
X |
X |
|
Modify rules for mapping products to POG sets |
All assortments |
X |
X |
||
|
Analyze space-optimized assortments |
All assortments |
X |
X |
X |
X |
|
Finalize and export space-optimized assortments |
All assortments |
X |
|||
|
Roll back finalized and exported space-optimized assortments |
All assortments |
X |
|||
|
View list of space-optimized assortments |
All assortments |
X |
X |
X |
X |
|
Delete unprocessed assortment |
All assortments |
X |
Table 6-2 User Constraints
| Role | Privilege | Object | Status | ||
|---|---|---|---|---|---|
|
Users |
Cannot |
Modify existing ASO run |
When |
Run is |
Running, approved, or finalized |
|
Users |
Cannot |
Submit or resubmit ASO runs |
When |
Run is |
Running, approved, or finalized |
|
Users |
Cannot |
Approve ASO runs |
Unless |
Run is |
Complete |
|
Users |
Cannot |
Delete saved ASO runs |
When |
Run is |
Running, approved, or finalized |
|
Administrator |
Cannot |
Delete saved ASO runs |
When |
Run is |
Finalized |
|
Users |
Cannot |
Modify mapping of products in POG sets |
Unless |
Assortment is |
With status of POG Mapping Needs Review |
|
Users |
Cannot |
Toggle assortment status between Ready for ASO and POG Mapping Needs Review |
When |
Assortment is |
With status of POG Mapping Needs Review and also has mappings with errors (both conditions must be true) |
|
Users |
Cannot |
Modify rules for mapping products to POG sets |
When |
Assortment is |
Finalized or exported |
Table 6-3 Privilege Descriptions
| Privilege | Description |
|---|---|
|
Create new ASO run |
Set up and execute optimizations. All steps on the main train can be carried out, including creating a new run via the copy run or the save as functionality. |
|
Modify existing ASO run |
Open an existing run and modify settings. The user can visit and change settings on any step in the main train. This includes performing VPOG overrides for the optimal VPOGs that are generated by the run. |
|
Modify the name and description of an existing ASO run |
Open an existing run and modify the name and description of that run. |
|
View existing ASO run |
Open an existing run and visit any step in the main train. The user can view data and search/aggregate/filter but cannot change anything. This includes viewing the optimal VPOGs that are generated by the run and comparing them to historical VPOGs. |
|
Submit or re-submit ASO run |
Submit a new or modified run or restart a failed run. This includes validating a run. |
|
Approve ASO runs |
Approve run results. |
|
Delete saved runs |
Delete run setup information and results from the database. |
|
View list of saved runs |
View a list of summary details about each saved run. |
|
View mapping of products to POG sets |
View the mapping of products to POG sets by assortment. |
|
Modify mapping of products to POG sets |
Modify the mapping and related data of products to POG sets by assortment. This includes altering the mappings by using the re-map functionality, which refreshes an assortment's mappings based on the pre-configured rules. |
|
Toggle assortment status between Ready for ASO and POG mapping needs review |
Toggle an assortment's status between Ready for ASO and POG mapping needs review. |
|
View rules for mapping products to POG sets |
View the rules that determine how products are mapped to POG sets. |
|
Modify rules for mapping products to POG sets |
Edit the rules that determine how products are mapped to POG sets. |
|
Analyze space optimized assortments |
Aggregate approved runs to the assortment level prior to approval for export to CMPO. |
|
Finalize and export space optimized assortments |
Finalize assortments and export the aggregated assortment data to export to CMPO. |
|
Rollback finalized and exported space optimized assortments |
Roll back a finalized assortment or an exported assortment. |
|
View list of space optimized assortments |
View a list of summary details about each of the space-optimized assortments. |
|
Delete unprocessed assortment |
Delete assortments that have not moved into ASO processing. Only assortments that have the following statuses can be deleted: Received, Data Errors, Ready for Mapping, Discarded, and POG Mapping Needs Review. |
The ASO Cloud Service user interface, at a high level, consists of
Task pane. Located on the left side of the application. Use this to navigate between the four main tabs.
The four tabs that you use to do the application work: Optimization List, Assortment List, Execute Space Optimization, and Assortment Mapping.
Contextual information. Located on the right side of the application. Use the various tabs to set up runs and to view graphical and tabular data that can help you as you interpret the optimization results. In addition, the tools can be used during the run setup to provide additional information about data involved in the run setup.
The following icons are used in user interface. Certain icons have slightly different definitions, depending on the context.
Table 6-4 Icons
| Icon | Icon Description |
|---|---|
|
|
Add. Add row. |
|
|
Compare to history. |
|
|
Copy a run. Add a planogram. On the Assortment Mappings screen, it is used to create a like planogram. |
|
|
Create. Create a run. |
|
|
Detach. |
|
|
Delete. Delete a run. Delete planogram. |
|
|
Edit. Change status. |
|
|
Embedded help. |
|
|
Export to Excel. Export all. |
|
|
Freeze. |
|
|
Go to top. |
|
|
Go up. |
|
|
Move all items to other list. |
|
|
Move selected items to other list. |
|
|
Progress indicator. The indicator changes mode when the application is processing data. |
|
|
Query by example. |
|
|
Re-map. |
|
|
Refresh. |
|
|
Remove all items from list. |
|
|
Remove selected items from list. |
|
|
Required. |
|
|
Select date. |
|
|
Show as top. |
|
|
View configuration. View results. |
|
|
Wrap. |
Buttons are used to perform certain actions and for navigation.
Table 6-5 Buttons
| Button | Button Description |
|---|---|
|
Action |
Provides access to the following actions: Submit, Re-Submit, Validate, Save As, and Approve. |
|
Add All Stores |
Within the Add Stores dialog box, used to add all stores instead of a sub-group of stores. |
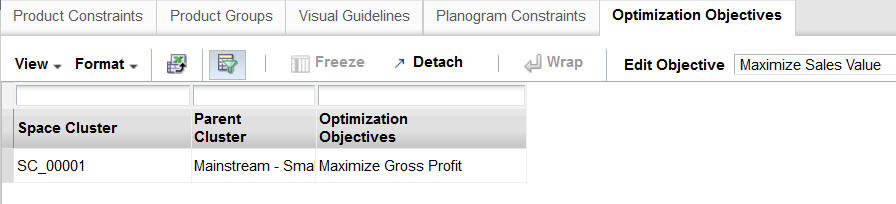
|
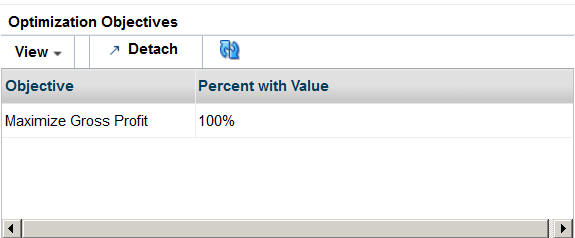
Apply |
In Optimization Objectives, used with the Edit Objectives drop-down list. |
|
Back |
Used to return to the previous train stop. |
|
Cancel |
Used to close a dialog box without making a selection. |
|
Choose Stores |
In Optimization Setup, when creating a new run, provides access to a dialog box for adding stores. |
|
Clear Selection |
In Assortment Analysis, clears the Selected Runs list. |
|
Details |
Radio button that toggles the display between a detailed view and a summary view. |
|
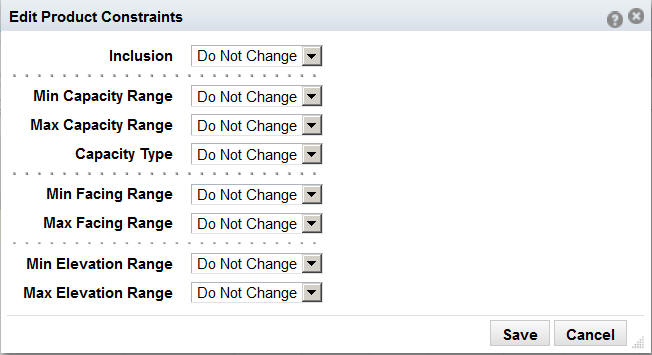
Edit Constraints |
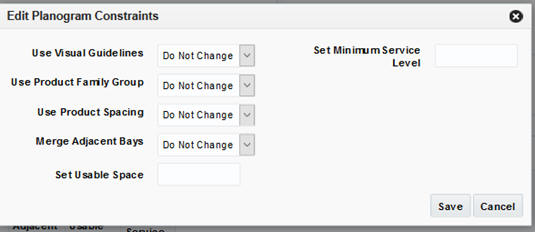
In Optimization Objectives, provides access to the Edit Constraints dialog box, which you use to edit settings. |
|
Export |
In Assortment Analysis, makes the selected finalized run available for use by other applications. |
|
Finalize |
In Assortment Analysis, finalizes the selected run. |
|
Next |
Moves to the next train stop. |
|
No Template |
Clears the template section. |
|
Save |
Saves the existing settings. |
|
Summary |
Radio button that toggles the display between a detailed view and a summary view. |
|
Table View |
Radio button that toggles the display between a table view of the data and a tree view of the data. |
|
Tree View |
Radio button that toggles the display between a table view of the data and a tree view of the data. |
|
View Results |
In Assortment Analysis, displays results for runs in the Selected Runs list. |
The user interface has three pull-down menus that provide access to a variety of functionality.
The Format pull-down menu and the View pull-down menu can be used to adjust how the display is organized. For example, you can resize the columns or detach a table from the interface.
The Actions pull-down menu provide functionality that you use to manipulate the application data. Some of the following functionality is also provided by the icons described in Table 6-4.
Table 6-6 Actions Pull-Down Menu Functionality
| Action Name | Description |
|---|---|
|
Create Run |
In Optimization List, takes user to Optimization Setup train stop. |
|
Copy Run |
In Optimization List, used to create a duplicate of an existing run. |
|
Delete Run |
In Optimization List, used to delete a run. |
|
Export to Excel |
Used to export to Excel. |
|
Rollback |
In Assortment List, used to revert the status of a run. |
|
Re-Map |
In Assortment Mapping, re-maps the planogram to product. This action must be executed after adding POGs, mapping data or any other information that has been delivered in order to correct exceptions or errors found by the assortment to POG mapping process. |
|
Add Planogram |
In Assortment Mapping, provides access to the Select Planogram Nodes dialog box. |
|
Delete Planogram |
In Assortment Mapping, used to delete the selected planogram. |
|
Add Row |
Add a row to the display. |
|
Mark for Optimization |
In Fixture and Product Data, used to select a product for optimization (indicated with a check mark). |
|
View Configuration |
In Fixture and Product Data, displays an empty planogram for the selected product. |
|
Compare to History |
In Fixture and Product Data, and in Results and Analysis, displays historical planogram that is populated. |
|
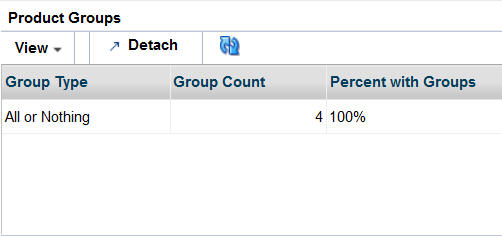
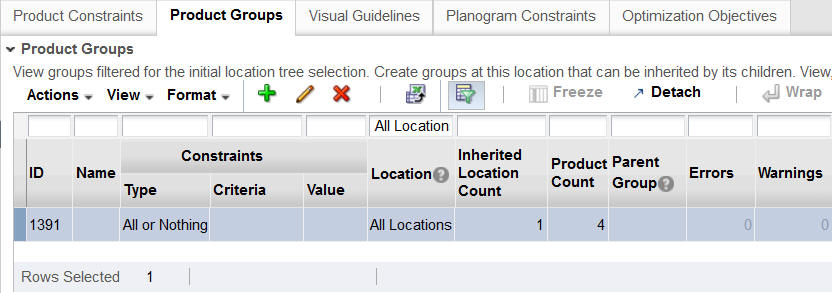
Add |
In Objectives and Constraints - Product Groups, used to add data. |
|
Edit |
In Objectives and Constraints - Product Groups, used to edit data. |
|
Delete |
In Objectives and Constraints - Product Groups, used to delete data. |
|
View Results |
In Assortment Analysis, processes the selected run. Once the processing is complete, the results are displayed in the table. |
|
Export All |
In Results and Analysis, used to export all the results. |
|
Create |
In Fixture and Product Data, used to create. |
|
Change Status |
In Assortment Mapping, used to update the status. |
|
Save As |
Makes a copy of the run that is currently open. |
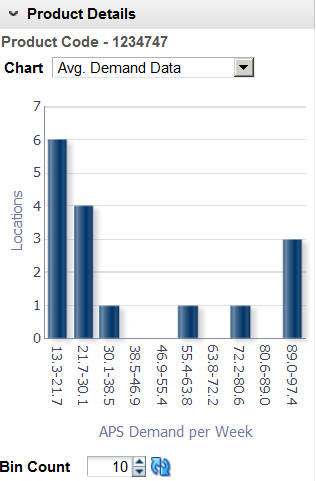
The stages have associated histograms available on the right-hand side of the display that can help you analyze the data presented in that stage. You can adjust the way the histogram presents the data by changing the number of bins that are used in the display. Once you change the number of bins, click the Refresh button to update the display.
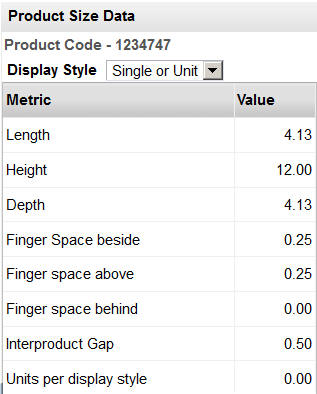
Certain stages have associated charts available on the right-hand side of the display that list data in a tabular format.
The process train displays the stages of Execute Space Optimization. The current stage is highlighted. You can also use the Back button and the Next button to move through the train.
Embedded help, which you access by clicking the Question Mark icon, provides additional information about the details required by certain fields.
ASO Cloud Service is used to optimize a category manager's assortment plan by creating optimal planograms. The category manager creates a preliminary assortment and wants to determine how well that list of products can fit in stores, given the available space, product sizes, and merchandising goals, constraints, and rules. The application creates virtual planograms that organize products onto fixtures in a way that best achieves the optimization objectives. Once the manager finalizes the optimization results, the product level data can be exported for use in planning applications.
An optimization can be carried out at one of two location levels: Store or Space Cluster.
In a Store level optimization:
each store is optimized separately, based on the store's individual data
one planogram is produced for each store
store-specific results are produced
In a Space Cluster level optimization:
every space cluster is optimized separately, based on aggregate store data
one planogram is produced for each space cluster
space-cluster-specific results are produced
A space cluster is an ad hoc group of stores used for optimization. Each space cluster includes stores that are in the same assortment, have the same product list, and have the same current planogram length. Space clusters are typically a level between assortment cluster and store. A fixture configuration can optionally be added to the clustering rules. ASO Cloud Service creates these groups by splitting stores from an assortment cluster into smaller groups of stores that have the same product list, the same current planogram length, and same fixture configuration if activated.
You can pick an existing run that was created for the same POG Set as a template. The system uses the settings for that run and applies them to a new run (which has a new group of products, locations, and data). This allows you to leverage the initial settings from the template run and use them across time, locations, planogram sets, and users. These templates work as follows:
Product Groups. ASO copies whatever is saved at the top level from the template run to destination run.
Objective Function and POG constraints. Most of the common values from the template are applied to all bottom levels in the new run. This includes the run objective, blocking constraint, spacing constraint, merge bay constraint, usable space constraint, and service level.
Product merchandising rules are copied as is from the template run to the destination run. This includes the fixture type, display style, orientation, capping, stacking/capping style, and max stack.
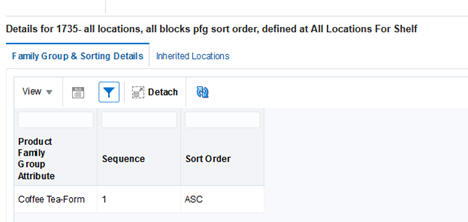
For visual guidelines, product family group, and sort order. the All Locations visual guidelines for each fixture type are copied to the destination run. For Product Family Group and Sort Order, the All Locations Product Family Group and Sort Order are copied to the destination run.
If the template run is set up at the space cluster-level and the destination run is set up at store level, then most common values will be taken from all lower levels as well whatever is defined at the top level (All Locations) that is applicable to the new run.
The user can select any run as a template; however, picking an unrelated run (a different POG set or assortment) will only transfer values that use the most common values. Most common values are not specific to any POG set or assortment; they are simply global values taken from the template run. In the template process, ASO discards any product/store level settings that exist only within template but are not valid for the destination run.
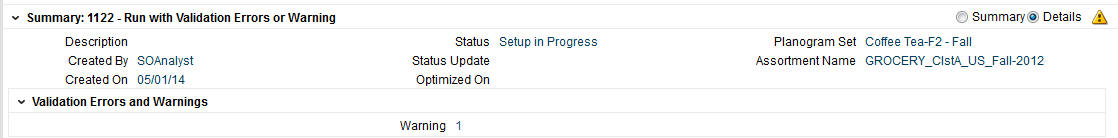
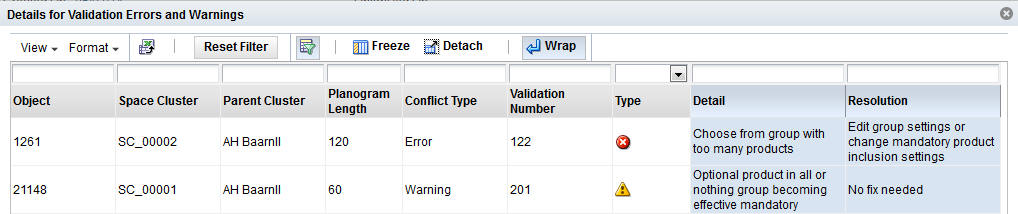
Within each stage, you can perform a validation. This provides you with feedback concerning the settings you have configured. Validation can identify conflicts between settings. You see details in the validation report that can help you to resolve any issues. Note that the validation is the same, regardless of which stage you invoke it from.
The conflicts identified by validation include warnings and errors. Warnings occur when constraints can impact or limit the optimization process. Errors prevent the optimization process from producing a solution.
ASO Cloud Service supports various planogram mappings, including the simple case in which a single product category is mapped to a single planogram as well as the case in which a product category's assortment is mapped to multiple planograms in many locations in a store.
If detailed shelving data is not available, a planogram cannot show the complete details about the shelving. In such cases, ASO Cloud Service creates fixture details using a combination of default values and user selection in order to assign shelves to partial shelf fixture planograms. This process occurs automatically when optimization locations are generated. These fixture configurations are available in the Fixture and Product Data stage. The user can manually override such planograms within the ASO Cloud Service user interface. See Planogram Setup for additional information.
ASO Cloud Service works with three types of fixtures: shelves, pegboards, and freezer chests. Freezer chests are not the containers in the frozen food section; rather, they are chests that shoppers reach down into in order to select a product. Planograms can support a mixture of shelves and pegboards.
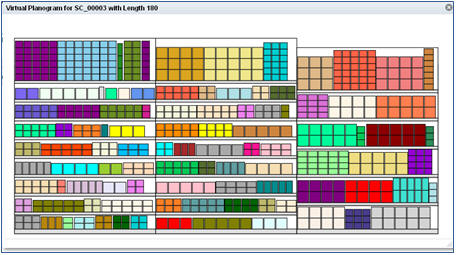
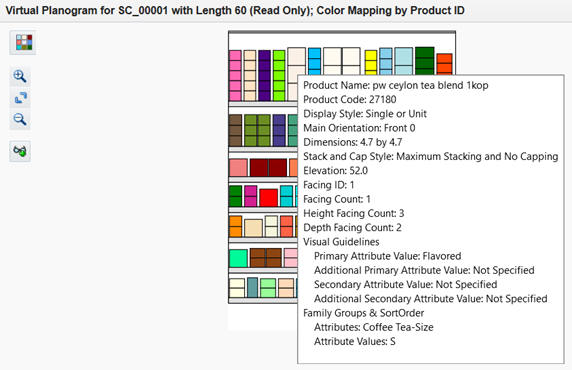
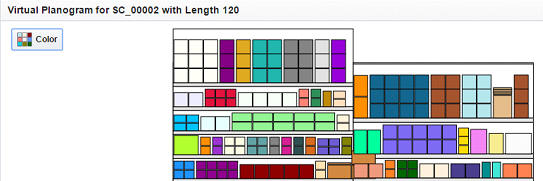
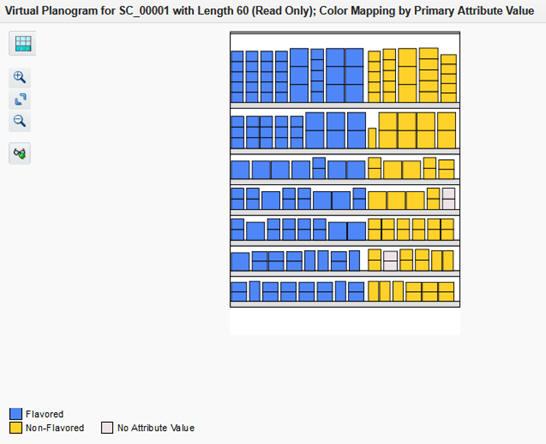
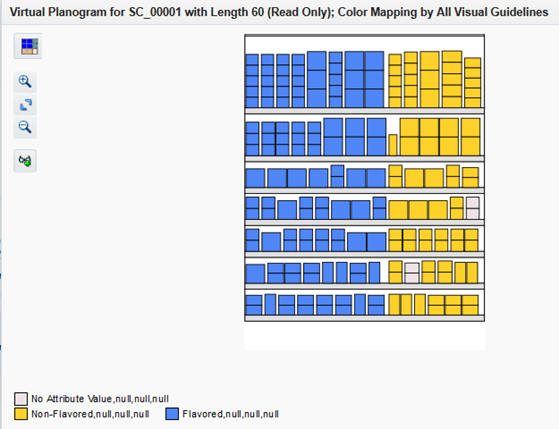
A virtual planogram (VPOG) is a planogram that is created by the application. It contains colored rectangles representing products, product groups, or images of products (when available), with supporting hover text for each product on the virtual planogram. A planogram is the layout of the product on shelves or pegboards with an underlying fixture assumption (for example, the number of shelves or the overall size).
A user can open multiple virtual planograms simultaneously in order to view images for different clusters or stores within the same run. However, only the first virtual planogram that a user opens can be edited, subject to the run status and the permission rules, until the open virtual planograms are closed. The application only supports the opening of multiple simultaneous virtual planograms if the user is using the same browser session, browser tab, and login session for the same optimization run. In other words, the user must open the multiple virtual planograms for a single run in a single run screen. All other combinations of browser sessions, browser tabs, and multiple logins to open multiple simultaneous virtual planogram windows are not supported. Although some combinations may work in practice, consistent UI behavior is not guaranteed and data integrity issues may occur.
Planogram set is an ASO concept that refers to a planogram node (which is the subcategory name) and concatenates it with the planogram season, with a hyphen between.
The Assortment Finalization process handles the assortment summarization of the results at the assortment set level as well as the transformation of placeholder product names and IDs into final products. This process is initiated by the Assortment Planning and Optimization (APO) module of CMPO. ASO loads and integrates the Assortment Finalization file with database objects. This triggers the following:
ASO generates aggregated results for all the exported assortments that have the same assortment set ID.
The only assortments that are aggregated are the ones that have been exported to APO.
All other assortments that have the same assortment set ID but that have a status other than exported are disabled so they can no longer be used in optimization or analysis.
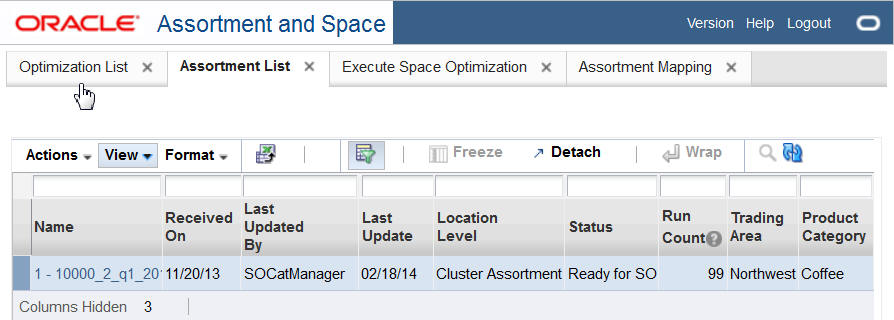
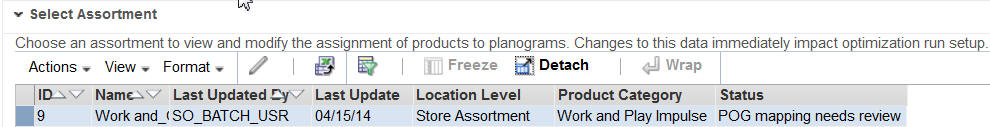
The Assortment List tab has one table that presents a list of all available assortments. You can use this information to view descriptive information and the status of each of the listed assortments. Use the Refresh icon to update the display.
You can also access the Assortment Analysis functionality from the Assortment List tab. You use the Assortment Analysis screen to determine how much of an assortment has or has not been optimized, to analyze the results of the optimizations, and to finalize and export your work.
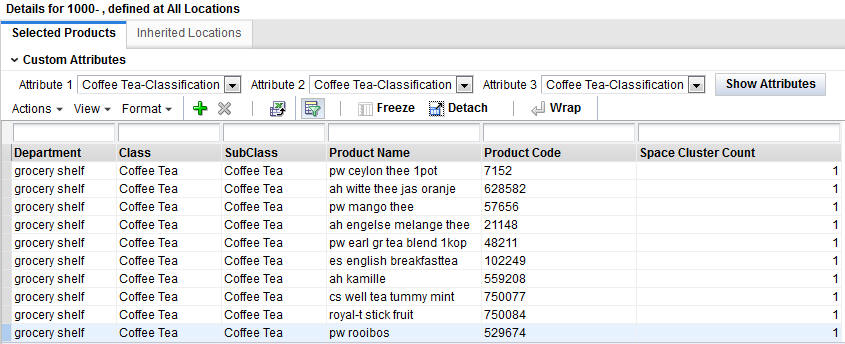
The Assortment List is shown in Figure 6-1.
It contains the following columns.
Table 6-7 Assortment List
| Field | Description |
|---|---|
|
Name |
The display name for the assortment. |
|
Goal |
The goal of the assortment. |
|
Role |
The role of the assortment. |
|
Tactic |
The tactic of the assortment. |
|
Received On |
The date the assortment was received. |
|
Last Updated By |
The user ID of the person who most recently updated the assortment. |
|
Last Update |
The date when the assortment was most recently updated. |
|
Location Level |
The location level for the assortment (Cluster Assortment, Store Assortment, or Space Cluster). This is the level at which the assortment data is delivered. Products are delivered once for all stores within a cluster (Cluster Assortment) or once for every store (Store Assortment) |
|
Status |
The status of the assortment in terms of space optimization. Values include Received, Data Errors, Ready for Mapping. POG Mapping Needs Review, User Re-Mapping, Ready for SO, Finalized, Exported, and Assortment Set Finalized. See Table 6-8 for details about each status. Select any assortment with a status of Finalized or Ready for SO in order to display that assortment in Assortment Analysis. |
|
Run Count |
The total number of existing optimization runs (regardless of status) that have occurred, based on a planogram set that is included in the assortment. |
|
Trading Area |
The trading area for the assortment. |
|
Product Category |
The product category for the assortment. |
Table 6-8 Assortment Status Descriptions
| Status | Description |
|---|---|
|
Received |
The assortment has been received by ASO and has been loaded within ASO tables. |
|
Data Errors |
The assortment has been validated by ASO against other datasets in the application, and errors have been found. Assortments that have failed global validation checks will have a change of status to Data Errors and will not be included in any further processing until the data is fixed and a new global validation run verifies the data integrity. |
|
Ready for Mapping |
The assortment has passed global validation so its status has changed to Ready for Mapping. As a result, the assortment can now be included in the Assortment to POG mapping process. |
|
POG Mapping Needs Review |
The mapping process has been executed and some exceptions have been found that require user review. Depending on the system configuration, a review might be required, regardless of mapping process results. |
|
User Re-Mapping |
Internal state is not visible in UI. This is an internal indicator for a new mapping request from the user. |
|
Ready for SO |
The assortment has been mapped. It is exception free and available for use within the optimization process. |
|
Finalized |
An individual assortment reaches this status once the assortment's results have been reviewed and accepted by the user. |
|
Exported |
The final status of the individual assortment, indicating that the data is available for export. |
|
Assortment Set Finalized |
This is a signal from APO indicating that the processing for the whole assortment has ended and that the combined results from the related assortments in SET should be created and made available for export. |
The Rollback functionality is available from the Action drop-down menu.
If the current status of the assortment is Exported, the status rolls back to Finalized. After the rollback from Exported, the assortment is not available to external application (as it was when it had a status of Exported).
You cannot roll back any run. If an assortment is in Finalized status, you will not be able to create any new runs based on POG sets within that assortment so you must roll the assortment back to Ready for SO status, create more optimization runs, and finalize again if necessary.
An assortment cannot be part of an assortment set that has been finalized. In such cases, the rollback menu option is disabled.
When you roll back an assortment to Ready for SO, you cannot export it but you can finalize eligible runs that are associated with the assortment that were not finalized before. In addition, once you have rolled the assortment back to Ready for SO, you can create new runs that are based on planogram sets associated with the assortment, something you cannot do when the assortment is in status of Finalized or Exported.
Assortment Analysis is available for an assortment if one or more of the runs associated with that assortment have been approved. Such runs have a status of Approved or Finalized. CMPO users and SO analysts have permission to conduct this analysis. The SO Super User can access this screen as read-only.
The Assortment Analysis screen can be used to:
determine how much of a specific assortment has not been optimized
examine the aggregated results of the approved runs for a specific assortment
finalize the optimized results
export the results
To access Assortment Analysis, select an assortment from the Assortment List that has a status of Ready for SO or Finalized. You see the Assortment Analysis screen. This screen consists of three distinct areas.
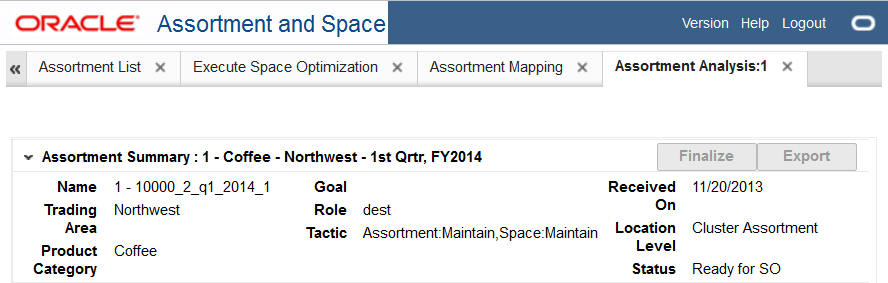
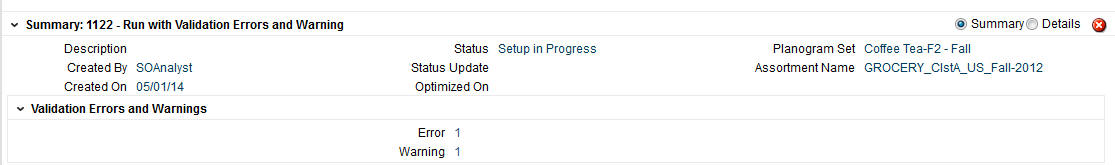
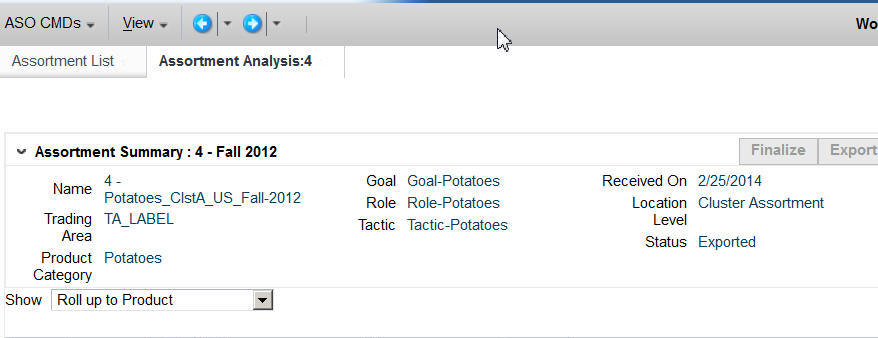
Assortment Summary
This section of the Assortment Analysis screen, shown in Figure 6-2, displays a subset of the information contained in the Assortment List. The information describes the assortment you selected.
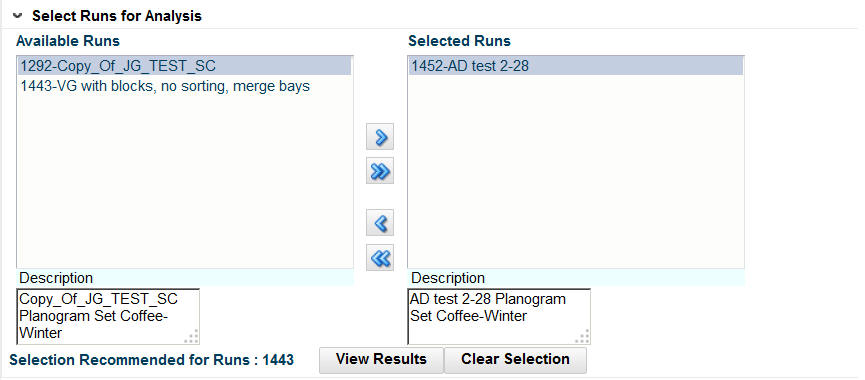
Select Runs for Analysis
This section, shown in Figure 6-3, displays the runs for the assortment you selected. The Available Runs lists all the runs associated with the assortment whose status is Approved or Finalized. Only approved or finalized runs appear here. The Selected Runs lists the runs whose results you are interested in viewing. Overlaps may exist across selected runs. In that case, results from the most recently approved or finalized run take precedence over other runs with the same sku/store combination.
The Selected Runs list is also used to control which runs become finalized. If you select more than a run that covers the same product/location, you will only see results from the run with the most recent results data.
To move all runs from the Available Runs list to the Selected Runs list, click the double arrow.
To move a select group of runs from the Available Runs list to the Selected Runs list, highlight the run or runs you want in the Available Runs list and click the single arrow.
To moves runs from the Selected Runs list to the Available Runs list, you should reverse this process.
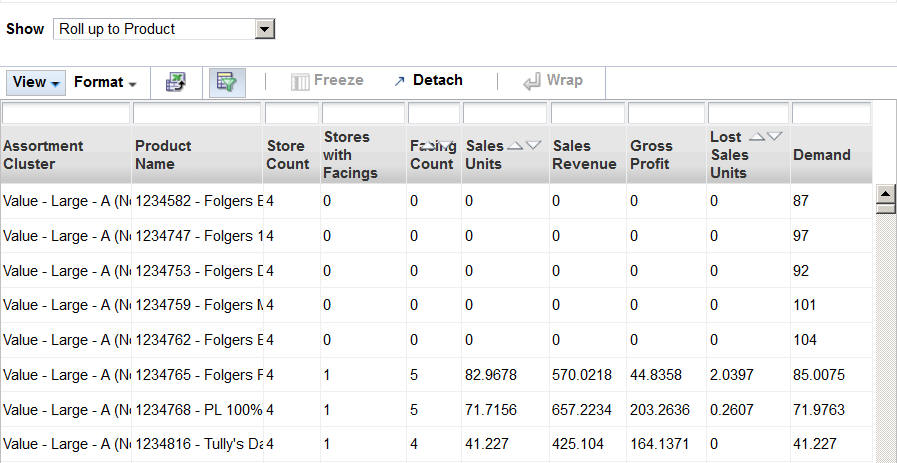
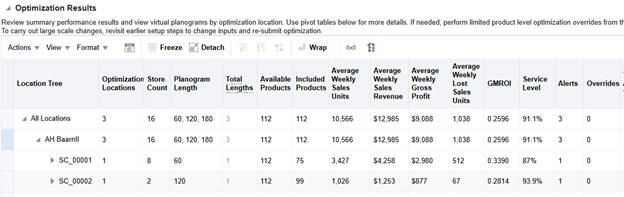
Run Results
To display the results of a run in the Run Results table, shown in Figure 6-4, highlight the run, and click the View Results button. (Note that some columns are hidden so that the figure fits on the page.)
By default, the results are displayed for all data. To display the data at different levels of aggregation, use the Show drop-down list. You can choose from the following options:
All data
Roll up to Assortment Cluster (a single line is displayed for the entire cluster)
Roll up to Product. Product: Results are displayed at the Assortment Cluster/Product level. You see one line for each product within each cluster.
Roll up to Planogram Set. Results are displayed at the Assortment Cluster/Product/Planogram Set level. You see one line for each planogram set that a product belongs to within an assortment cluster.
To clear the display, click the Clear Selection button. This clears the results from the results table and moves all of the runs in the Selected Runs list back into the Available Runs list (resets the user selection).
Results Table
The Results Table displays the following information at the aggregation level you selected. Note that each aggregation level displays only a subset of the information listed in Table 6-9.
Table 6-9 Results Table
| Column Name | Description | Displayed at Aggregation Level |
|---|---|---|
|
Assortment Cluster |
The name that identifies the cluster. |
All, Cluster, Product, Planogram Set |
|
Product Code |
The code assigned to the product. |
All, Product, Planogram Set |
|
Product Name |
The name that identifies the product. |
All, Product, Planogram Set |
|
Planogram Set |
The name that identifies the planogram set. The name is a concatenation of the subcategory name and the season name. |
All, Planogram Set |
|
Store Code |
The code assigned to the store. |
All |
|
Store Name |
The name that identifies the store. |
All |
|
Run ID |
The ID that identifies the specific run. This is useful for assortments with more than one run. |
All |
|
Store Count |
Tells the user how many stores the data from that row represents. |
Product, Planogram Set |
|
Stores with Facings |
The number of stores whose facing count is greater than 0 (see Store Count description). |
Product, Planogram Set |
|
Facing Count |
The facing count. |
All, Cluster, Product, Planogram Set |
|
Sales Units |
The number of the standard sales category for a product. |
All, Cluster, Product, Planogram Set |
|
Sales Revenue |
The amount of revenue for the product. |
All, Cluster, Product, Planogram Set |
|
Gross Profit |
The difference between sales revenue and cost. |
All, Cluster, Product, Planogram Set |
|
Lost Sales Units |
The lost sales units. |
All, Cluster, Product, Planogram Set |
|
Demand |
The demand. |
All, Cluster, Product, Planogram Set |
Finalizing an Assortment
Which runs are finalized is based on which runs are used to generate the results data (the set of unique Run IDs in the View Results table). In order to determine the runs used to generate the data, the most current run for each product/store is determined. For example, when you view the results for All, you may see records that have different Run IDs.
The Selection Recommended for Runs should include all runs used to generate the results. A run must be in this list and in the Selected Runs list in order to become finalized when the assortment is finalized.
Once you are satisfied with the results and finalize an assortment, it is available for export to CMPO and Space Planning.
Once an assortment is finalized, the status as displayed in the Assortment List changes to Finalized.
To finalize an assortment, open it in the Assortment Analysis screen, select the runs you want to finalize, and click the Finalize button.
Exporting the Run Results
Once an assortment is finalized, the Export button is enabled and the Finalize button is disabled. Click the Export button in order to export the results. Once the assortment is exported, the results of the export are displayed in the Assortment Analysis table, as shown in Figure 6-5, and you can no longer select the runs for analysis. At this point, the Assortment Analysis display consists only of the Summary and the Results. The Select Runs for Analysis section is not displayed.
Figure 6-5 Assortment Analysis After Export
Once an assortment is exported, the status of the run as displayed in the Assortment List changes to Exported. The status is also shown on the Assortment Analysis screen, in the Summary section.
Once the assortment is finalized and exported, it is no longer available in the Select Planogram Set in Execute Space Optimization.
An assortment cannot be part of an assortment set that has been finalized. In such cases, the export button is disabled.
The runs that are finalized may represent a subset of the group of approved runs.
Assortment Analysis Metrics
The metrics displayed in the Assortment Summary list and in the Run Results list can be different. This can occur when there is more than one run, as the run results roll-up to Space Cluster or Store (optimization location) and the assortment analysis rolls up to Assortment Cluster.
Specifically, the metrics Units, Sales Revenue, Gross Profit and Lost Sales Units obtained from run results are summarized across all optimization location for all stores. These values match the assortment analysis rollup to assortment cluster when that run is the only selected. The metrics Facing and Demand actually match but are presented at different levels within the two screens. The run results bottom panel - included products shows those values as an average per store, while the assortment analysis screen shows those values just as the other metrics: across all the stores within the cluster.
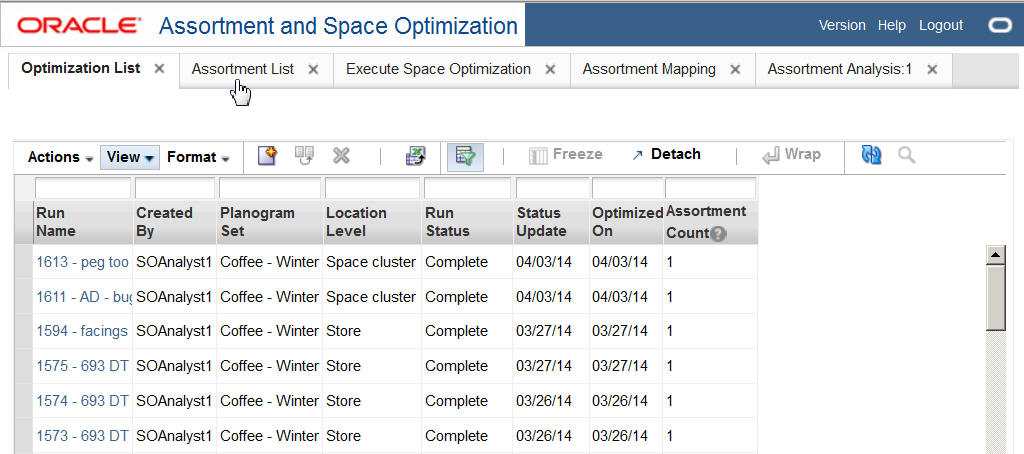
The Optimization List is the dashboard for the ASO runs. In this tab, you can see a list of all existing runs, along with details that describe each run. The list includes runs created by other users, which you can open in read-only mode. You can create a run, copy a run, open a run, or delete a run.
The optimization list, shown in Figure 6-6, includes the columns described in Table 6-10.
Table 6-10 Optimization List
| Field | Description |
|---|---|
|
Run Name |
The Run Name is built by concatenating the internal Run ID and the user-provided name. |
|
Created By |
The login ID of the user who created the run. |
|
Planogram Set |
A description of the POG set. The name is a concatenation of the subcategory name and the season name. |
|
Location Level |
The location level selected for optimization (Store or Space Cluster). |
|
Optimized On |
The date when the run was optimized. |
|
Status Update |
The date when the status was last updated. |
|
Run Status |
The current status of the run. Values include Setup in Progress, Submitted, Running, Complete, Data Error, Technical Failure, Approved, and Finalized. See Table 6-11for details about each status. |
|
Assortment Count |
The number of assortments to which the run applies (this is based on how many assortments include the planogram set that is set for the run) |
|
Description |
The user-provided description for the run. |
Table 6-11 Run Status Description
| Status | Description |
|---|---|
|
Setup in Progress |
User is setting up the run, which has not yet been submitted for optimization. |
|
Submitted |
The user has submitted the run for optimization. |
|
Running |
The run optimization process is currently running. |
|
Complete |
The optimization process is complete, and the run results are ready for review. |
|
Data Error |
Execution was suspended/aborted due to data errors. |
|
Technical Failure |
An unexpected condition (technical) has caused the optimization run to abort execution. |
|
Approved |
The run results have been reviewed and approved for assortment analysis. |
|
Finalized |
The run results have been included in the assortment finalization and are ready for export to other applications. |
To create a new run, click the Create Run icon. You are taken to the Optimization Setup stage in the Execute Space Optimization tab.
In order to create a run, you must have either Micro-space opt analyst permission or analytical super user permission.
To copy an existing run, highlight that run in the displayed list and click the Copy Run icon. Alternatively, you can also open the run you want to copy and then choose Save As from Action menu. You are taken to the Optimization Setup stage in the Execute Space Optimization tab. The fields are populated with copies of all inputs and data. Any existing results are not included. The list of runs is updated with a run that has a new ID; all other fields match the existing run. Only the micro space opt analyst and analytical super user can create new runs.
To edit an existing run, highlight that run in the displayed list and click the run ID. Any user can open a run; however, only users with micro space opt analyst or analytical super user permissions can open a run in edit mode. Edit mode is only allowed for runs that a user created and only when the run does not have a status of Running, Approved, or Exported. All other runs are opened in read-only mode.
Runs can be deleted depending on the status of the run and the permissions a specific user has.
A user with Administrator permissions can delete any run except for one that has a status of Setup in Progress.
Users with micro space opt analyst or analytical super user can delete any runs they have created that do not have a status of Running, Approved, or Exported. They cannot delete runs created by another user.
More than one run can be selected for deletion at the same time.
The Execute Space Optimization tab provides a series of four stages that you progress through in order to set up, run, and analyze the results of the optimization run:
Optimization Setup. Used to pick a planogram set, the locations, and the optimization level.
Fixture and Product Data. Used to view or change fixtures and product merchandise settings.
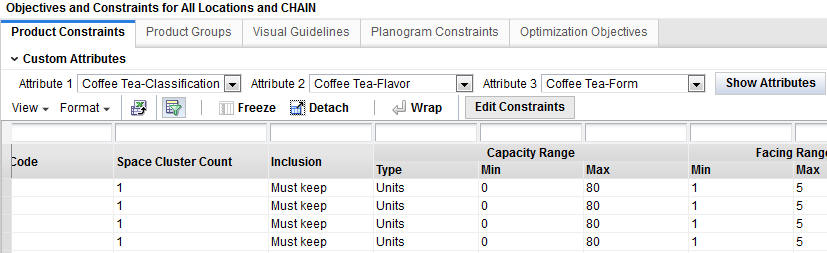
Objective and Constraints. Used to view or choose optimizations, objectives, and constraints.
Results and Analysis. Used to view results and override, approve, or revisit prior steps in order to make changes.
The Optimization Setup stage is used to pick a planogram set, the locations, and the optimization level. It is organized into three major sections: the Summary section, the Setup section, and the Review Optimization Locations section.
During this stage, if a planogram does not have detailed shelf information, ASO Cloud Service, using the smart start process, automatically assigns shelves to these partial shelf fixture planograms (PSFP) using configured parameters. These planograms are flagged in the Partial Fixtures column in the Planogram Fixtures tab (see Fixture and Product Data).
This tab is read-only if the run has been submitted to the system, if the user does not have permission to edit runs, or if the user has permission to edit runs but not create runs.
After you have made your selections, you can go to the next stage by clicking the Next button, submit the run for optimization, or validate the data. Use the Action menu to access Submit and Validate. If you submit the run for optimization at this point, the default rules and settings are used.
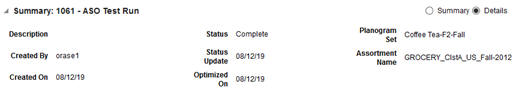
The Summary section, shown in Figure 6-7, identifies the run you are configuring. This section is populated once you provide the required information in the Setup section. It contains the fields listed in Table 6-12.
The Summary section is displayed at the top of each tab in the Execute Space Optimization stage.
Table 6-12 Summary Section Fields
| Field | Description |
|---|---|
|
Description |
The name for the run. |
|
Created By |
The user ID of the person who has created the run. |
|
Created On |
The date when the run was created. |
|
Status |
The status of the run. Values include Setup in Progress, Running, Complete, Approved, and Finalized. |
|
Status Update |
The date when the status for the run was last updated. |
|
Optimized On |
The date when the run was last submitted for optimization. |
|
Planogram Set |
The name of the planogram set, which is selected from the Select Planogram Set dialog box. A planogram set name is a concatenation of the subcategory name and the season name. |
|
Assortment Name |
A comma-separated list of all assortments associated with the run. |
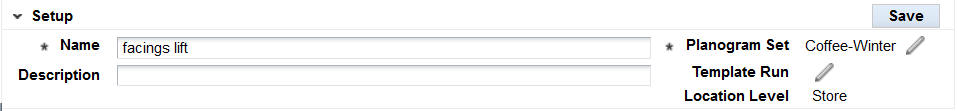
The Setup section, shown in Figure 6-8, is used to define and configure the run and provides access to dialog boxes that you use to select the Planogram sets and the optional Template to use for the run. In addition, you identify the Location Level for the run.
Click the Save button to save changes to the Name and Description fields. You also use this button to save changes to the planogram set, location level, and template run fields.
Table 6-13 Setup
| Field | Description |
|---|---|
|
Name |
The name identifying the run. The name must be 80 characters or less and use alphanumeric characters only. It is case sensitive. |
|
Description |
A brief description of the run. The value must be 200 characters or less and use alphanumeric characters only. |
|
Planogram Set |
The field displays the name of the planogram set you select for the run. The name is a concatenation of the subcategory name and the season name. Click the Pencil icon to access the Planogram Set dialog box, from which you make a selection. |
|
Template Run |
The field displays the name of the template you optionally select to use when creating a new run. Click the Pencil icon to access the Template Run dialog box, from which you make a selection. |
|
Location Level |
Choose the Location Level for the run from the drop-down list. Values are Space Cluster and Store. |
Use this check box to activate or deactivate the use of the POG configuration in the clustering process.
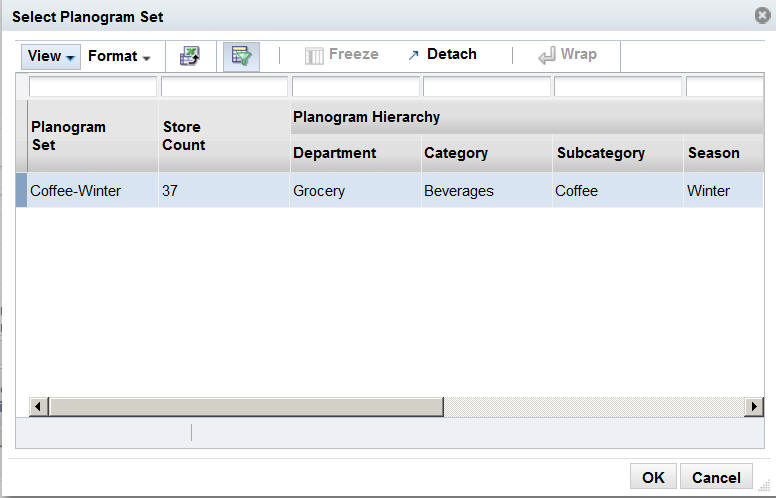
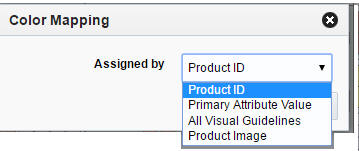
The Select Planogram Set dialog box, shown in Figure 6-9, which you access by clicking the Pencil icon adjacent to Planogram Set, lists all the planograms that are available to you for the run. You can select only one.
Highlight the appropriate row and click OK. If you change this selection after either selecting stores or building optimization location tables, then you must re-select the stores and the optimization locations for those stores.
Table 6-14 Select Planogram Set
| Field | Description |
|---|---|
|
Planogram Set |
The display name for the planogram set. The name is a concatenation of the subcategory name and the season name. |
|
Store Count |
The number of stores associated with the planogram set. |
|
Planogram Hierarchy Department |
The planogram set belongs within a hierarchy that consists of Department, Category, Subcategory, and Season. |
|
Planogram Hierarchy Category |
The planogram set belongs within a hierarchy that consists of Department, Category, Subcategory, and Season. |
|
Planogram Hierarchy Subcategory |
The planogram set belongs within a hierarchy that consists of Department, Category, Subcategory, and Season. |
|
Planogram Hierarchy Season |
The planogram set belongs within a hierarchy that consists of Department, Category, Subcategory, and Season. |
|
Assortment Details Product Category |
A comma-separated list of the assortment IDs that the planogram set applies to. |
|
Assortment Details ID |
The external ID of the planogram set. |
|
Assortment Details Name |
A comma-separated list of the assortment external IDs that the planogram set applies to. |
The Select Template Run dialog box, which you access by clicking the Pencil icon adjacent to Template Run, lists all the previous runs that are available to you to use as a template in creating a new run. You can select only one. Highlight the appropriate row and click Save. The new run you initialized uses values and settings that were used in the template run and apply to the new run. This is optional. You can use the No Template button to clear the template selection.
Table 6-15 Select Template Run
| Field | Description |
|---|---|
|
ID |
The ID that identifies the run. |
|
Name |
The name of the run. |
|
Description |
A brief description of the run. |
|
Planogram Set |
The planogram set associated with the run. |
|
Created By |
The user ID of the person who created the run. |
|
Run Status |
The status of the run. Values include Setup in Progress, Running, Complete, Approved, and Finalized. |
|
Status Update |
The date when the status for the run was last updated. |
The location level identifies the level at which the optimization occurs. You select either Space Cluster or Store from the drop-down list. If you change the value of this field after building the optimization locations, then the optimization locations are re-built using the store you selected and at the new location level.
Use this check box to enable space cluster generation based on the product list and POG length (base criteria) plus the additional POG attributes height, depth, and fixture type. If you select this check box and save the changes, the optimization location tables are refreshed based on the new setting.
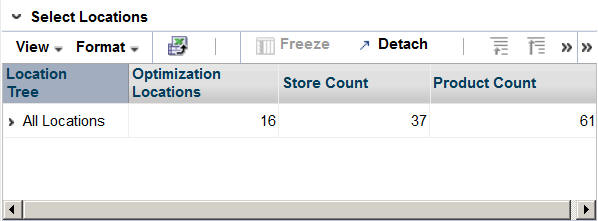
The Review Optimization Locations table, shown in Figure 6-10, displays the optimization locations for the optimization.
Figure 6-10 Review Optimization Locations
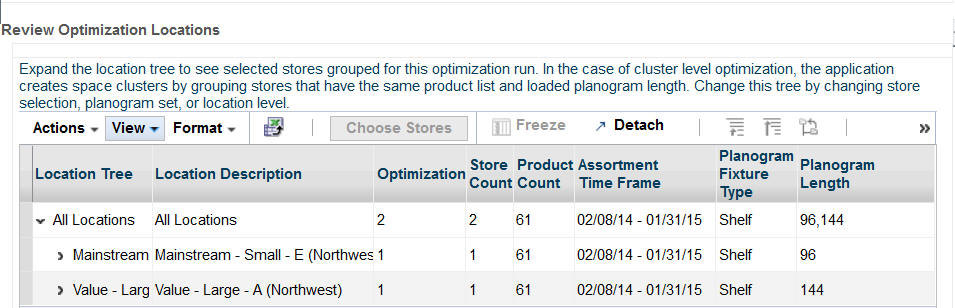
You can use this table to edit the list of existing locations or add new locations. The locations are listed in a tree structure that shows the hierarchy the optimization locations are part of. If the location level is set to Space Cluster, then the lowest level of the tree is space cluster. If the location level is set to Store, then the lowest level of the tree is store.
Table 6-16 Review Optimization Locations
| Field | Description |
|---|---|
|
Location Tree |
Displays the node name in the optimization location hierarchy tree. The lowest level is either space cluster of store. |
|
Location Description |
A brief description of the optimization location hierarchy node. |
|
Optimization Locations |
The number of optimization locations under the optimization location hierarchy node. The lowest level is always a value of 1. |
|
Store Count |
The number of stores in the optimization location hierarchy node. If the location level is store, then it will be a value of 1 for the lowest level. |
|
Product Count |
The number of products for the optimization location, based on the associated assortment. |
|
Assortment Time Frame |
The start date and end date for which the optimization location's associated assortment is valid, across products. |
|
Planogram Fixture Type |
A comma-separated list of unique planogram fixture types that exist for the optimization location hierarchy node. |
|
Planogram Length |
A comma-separated list of unique planogram lengths that exist for the optimization location hierarchy node. |
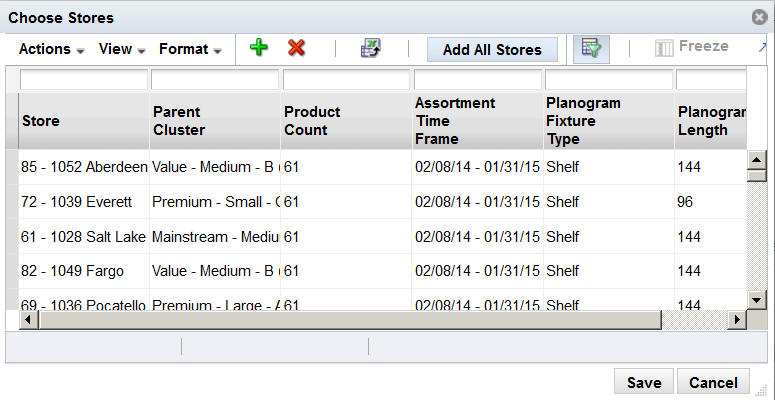
Click the Choose Stores button to add locations to the optimization run. The Selected Stores dialog box, shown in Figure 6-11, lists the stores that you have already selected for the optimization locations.
If you have not yet selected any stores, then no stores are listed and the table is blank. This can occur if you have changed the planogram set for the run or in the case of new runs (in which stores have not yet been added).
The Choose Stores dialog box contains the following fields:
Table 6-17 Choose Stores
| Field | Description |
|---|---|
|
Store |
The identification for the store. It is a concatenation of the store code and the store name. |
|
Parent Cluster |
The name of the cluster that the store belongs to. |
|
Product Count |
The number of products that the store carries that belong to the assortment associated with the planogram set that you selected. |
|
Assortment Time Frame |
The start date and end date during which the assortment associated with the planogram set you selected is valid. |
|
Planogram Fixture Type |
A comma-separated list of the unique planogram fixture types available for the associated planogram set's assortment at the store. |
|
Planogram Length |
A comma-separated list of the unique planogram lengths available for the associated planogram set's assortment at the store. |
You use the Choose Stores dialog box for adding stores and deleting stores. It is enabled once you provide the required information in the Summary section. To add stores, click the Add icon in order to access the Adding Stores functionality. To delete stores, highlight one or more stores from the Choose Stores list and click the Delete icon. You can also click the Add All Stores button in order to add all the stores for which the planogram set you selected applies.
When you click OK in the Choose Stores dialog box, the list of selected stores is saved and the optimization locations are built or re-built. As long as the run is in a state in which the optimization locations can be edited, you can update the list and re-build the optimization locations.
When you click Cancel in the Choose Store dialog box, all the changes you have made to the list of selected stores are reverted and no changes are made to the optimization locations.
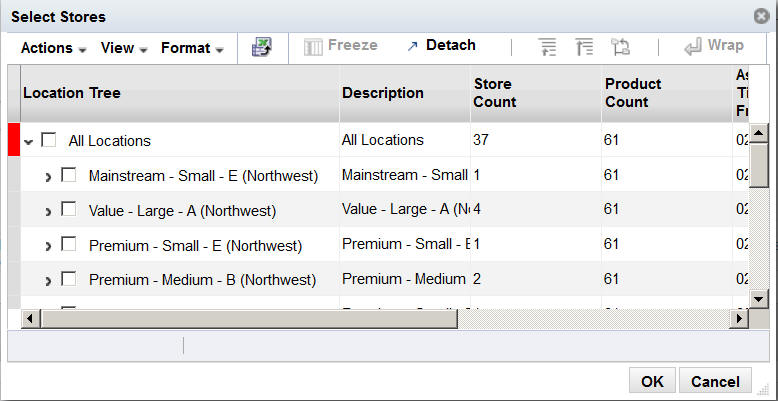
You add stores through the Select Stores dialog box, which you access by clicking the Add icon in the Choose Stores dialog box. The Select Stores dialog box, shown in Figure 6-12, displays a list of stores that can be added to the optimization run, based on the run's Planogram Set value.
The Select Stores dialog box contains the following fields:
Table 6-18 Select Stores
| Field | Description |
|---|---|
|
Location Tree |
The name of the location hierarchy node. If it is the lowest level, it is space cluster or store. |
|
Description |
A brief description of the location hierarchy node. |
|
Store Count |
The number of stores in the optimization location hierarchy node. If the location level is store, then it will be a value of 1 for the lowest level. |
|
Product Count |
The number of products in the location, based on the associated assortment. |
|
Assortment Time Frame |
The start date and end date during which the location's associated assortment is valid. |
|
Planogram Fixture Type |
A comma-separated list of unique planogram fixture types for the location hierarchy node. |
|
Planogram Length |
A comma-separated list of unique planogram lengths for the location hierarchy node. |
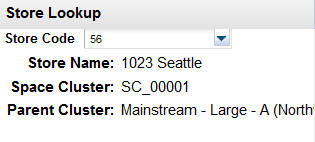
The following information is only available when the optimization locations have been defined.
You can use Store Lookup, shown in Figure 6-13, to access information about a store. You must provide the store code, either by entering it into the text field provided or by selecting it from the drop-down list. This list is populated based on the optimization location selected for the run.
Once you select the store, you see the following information:
Store name
Optimization location (if location level is Space Cluster)
Parent cluster
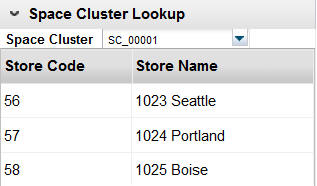
You can use the Space Cluster Lookup, shown in Figure 6-14, to see the list of stores associated with a specific space cluster. You must provide the name of the space cluster, either by entering it into the text field provided or be selecting it from the drop-down list. The list is populated based on the optimization location selected for the run.
Once you select the space cluster, you see a list of the component stores.
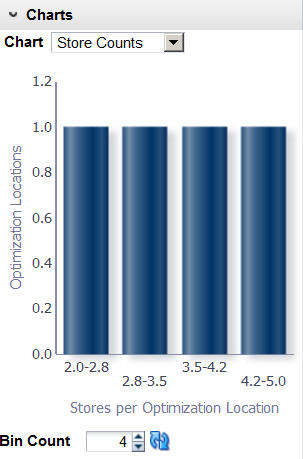
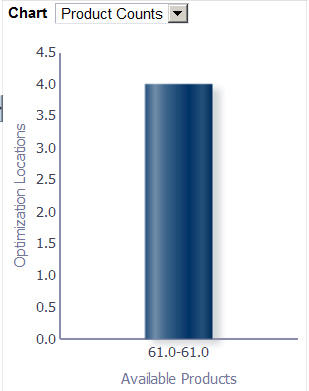
Two charts are provided in which you can see the variation in store counts by optimization location and product counts by optimization location. The charts are populated with data once the optimization location has been configured. Figure 6-15 provides an example of the store counts chart and Figure 6-16 provides an example of the product counts chart.
The Fixture and Product Data stage is divided into a Summary section, a Planogram Fixtures tab, and a Product Merchandising Data tab. The Summary section identifies the characteristics of the run. The Planogram Fixtures tab is used to review the available planogram lengths for each optimization location and to update the selected configuration for each available length from a set of configurations for each length. The Product Merchandising Data tab is used to assign merchandising options to products. These assignments can vary by product or optimization location.
This tab can only be edited by the user who created the run and only before the run has a status of Running, Approved, or Finalized.
The Summary section, shown in Figure 6-7, identifies the run you are configuring.
Table 6-19 Summary Section Fields
| Field | Description |
|---|---|
|
Description |
The name for the run. |
|
Created By |
The user ID of the person who has created the run. |
|
Created On |
The date when the run was created. |
|
Status |
The status of the run. Values include Setup in Progress, Running, Complete, Approved, and Finalized. |
|
Status Update |
The date when the status for the run was last updated. |
|
Optimized On |
The date when the run was last submitted for optimization. |
|
Planogram Set |
The name of the planogram set, which is selected from the Select Planogram Set dialog box. |
|
Assortment Name |
The name of the assortment associated with the planogram set. |
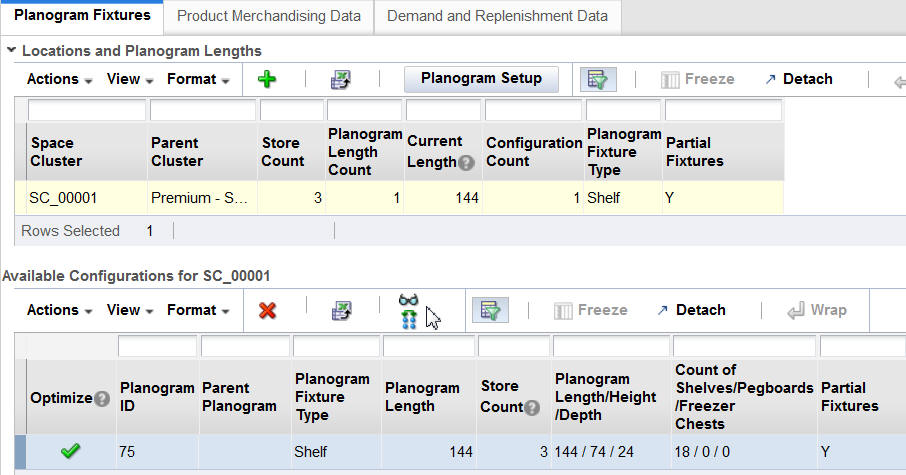
The Planogram Fixtures tab contains two sections: the Locations and Planogram Lengths table and the Available Configurations table.
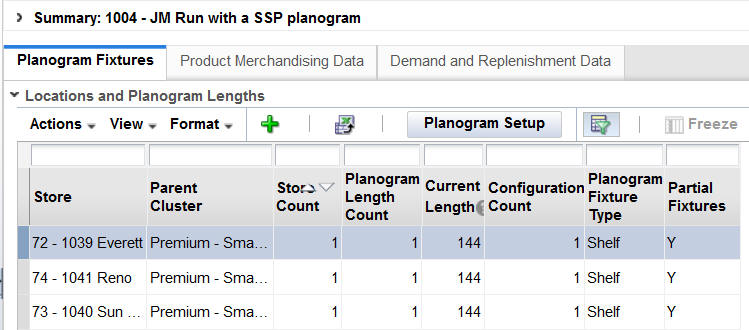
This table, shown in Figure 6-17, displays the run's optimization location and provides metrics about the available planogram configurations for each run.
Figure 6-17 Locations and Planogram Lengths
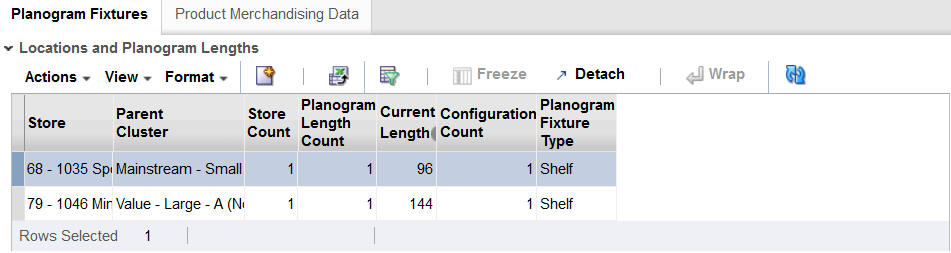
You can create new lengths, which can be either shorter or longer than the current lengths (subject to validation), and refresh the table display.
Table 6-20 Locations and Planogram Lengths
| Field | Description |
|---|---|
|
Space Cluster/Store |
The name of the space cluster or store. |
|
Parent Cluster |
The name of the parent cluster of the optimization location. |
|
Store Count |
The number of stores in the optimization location. |
|
Current Length |
The length of the configuration that is currently ready for optimization. |
|
Planogram Length Count |
The number of unique planogram lengths in the optimization location. |
|
Configuration Count |
The number of planogram configurations in the optimization location. |
|
Planogram Fixture Type |
A comma-separated list of the unique fixture types present across all configurations that are ready for optimization. This list includes fixture types that have been created by the user. |
|
Partial Fixtures |
Y indicates that the planogram does not have detailed shelving data and that the fixture configuration has been generated based on configuration parameters. N indicates that the planogram has complete shelving data. |
Planogram Setup
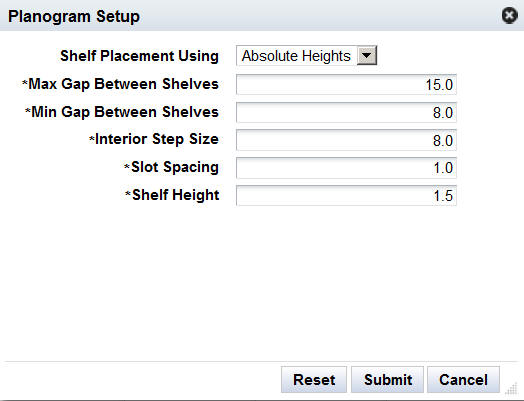
Select Planogram Setup to access the Planogram Setup dialog box. This button in enabled after you select at least one optimization location row from the table. The Planogram Setup dialog box contains the parameters used during the smart setup process to generate the Partial Shelf Fixture Planogram (PSFP). You can edit these parameters and rerun this process using this dialog box. These parameters are described in Table 6-21. Note that the allowable minimum and maximum values permitted in this dialog box are configured in the database.
Table 6-21 Planogram Setup Parameters
| Field | Description |
|---|---|
|
Shelf Placement Using |
This drop-down menu as two options, Height Percentile and Absolute Height. The choice you make between these two options determines the types of values (percentage or numeric) used by some of the parameters and which parameters are displayed. |
|
Max Gap Between Shelves |
When using Height Percentile: Select the Nth percentile from the distribution of product heights in the assortment as the maximum gap between two shelves.When using Absolute Height: Use the provided value as the maximum gap between two shelves |
|
Min Gap Between Shelves |
When using Height Percentile: Select the Nth percentile from the distribution of product heights in the assortment as the minimum gap between two shelves.When using Absolute Height: Use the provided value as the minimum gap between two shelves |
|
Interior Step Size |
When using Height Percentile: Reduce the height percentile to use for each subsequent shelf placement (e.g. with a max of 100% and step of 20%, the next shelf placement will use the 80th percentile of product heights to determine the gap) When using Absolute Height: Determine the gap between interior shelves using the step size |
|
Absolute Min Gap |
The absolute minimum gap between two shelves, regardless of product height percentiles. |
|
Slot Spacing |
Distance between slots in the bay. Final shelf placement will round to the nearest slot position. |
|
Shelf Thickness |
Thickness of all shelves placed using the Smart Start Process. Shelf thickness is considered when calculating the gaps between shelving. |
The following buttons are available in this dialog box:
Reset – Use this button to update the values for all the parameters to the configured default values. You must then click Submit to rerun the smart setup process.
Submit – Use this button to rerun the smart start process for the optimization locations you selected, based on the parameter values you entered here. When you click this button, the dialog box closes and the available configurations table is refreshed with the new configurations generated by the smart setup process. The new values that you provided for the parameters are saved at the optimization location level.
Cancel – Use this button to close the dialog box without making any changes.
If some of the locations you select do not have partial fixtures, they are not processed by the smart setup process. You will see a message if this occurs.
If some of the locations you select also have overrides that apply, these overrides are also applied. You will see a warning message if this is the case.
Planogram Setup Shelf Placement
When planogram setup parameters are submitted, the system calculates shelf positions using the selected process (percentile or absolute). The shelf placement rules for each process are summarized in Table 6-22 and Table 6-23 in the order in which they are applied.
Table 6-22 Height Percentile Shelf Placement Rules
| Shelf Position | Rule Description |
|---|---|
|
Top Shelf |
Place the shelf at (fixture height - (top shelf stacking limit + shelf thickness)), rounded down to the nearest slot position. |
|
Bottom Shelf |
The bottom shelf goes in position 0. |
|
Interior Shelves |
Starting from the bottom, calculate the gap to the next shelf using product height percentiles. The first interior shelf is placed using the product height at the Max Gap percentile, and each subsequent gap is decreased based on the step size percentile, rounded up to the nearest slot. |
Table 6-23 Absolute Height Shelf Placement Rules
| Shelf Position | Rule Description |
|---|---|
|
Top Shelf |
Place the shelf at (fixture height - (top shelf stacking limit + shelf thickness)), rounded down to the nearest slot position. |
|
Bottom Shelf |
The bottom shelf goes in position 0. |
|
Interior Shelves |
Starting from the bottom, calculate the gap to the next shelf using the max gap values and step size. The first interior shelf is placed using the max gap size, and each subsequent gap is determined by the step size, rounded up to the nearest slot. |
The same process is applied to all empty bays in the planogram, such that multiple bays of the same height have identical shelving. Other fixture types (such as pegboards) are not considered during this process, and bays that already have fixtures are not modified. After the process has been run, the user can override the results by editing the planogram directly. See Fixture Overrides for details.
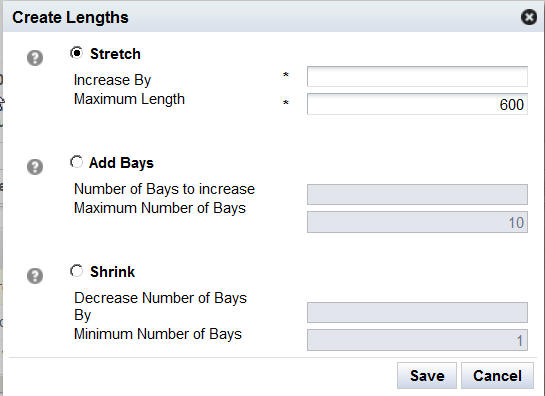
Create Lengths
Select Create from the Actions menu to access the Create Lengths dialog box, shown in Figure 6-20. You use this to create new planogram configurations for the optimization locations you select. This involves stretching or shrinking a configuration that is marked for optimization. In addition, you can add new bays to the right. If you want to create new lengths for a configuration that has not been marked for optimization, you must mark that configuration for optimization. but it must be a loaded configuration, which can be identified by the fact that the Parent Planogram field is empty or null.
Stretch
To stretch the length, select the Stretch radio button. Stretching changes the planogram by adding length to the last bay (including internal objects). It adds as much length as defined within the Increase By field up to the maximum length.
A new configuration is created that is a copy of the base configuration. The planogram is shrunk by removing the bays from right to left. The length, in generic measurement length units, is adjusted based on the bays that are removed. That copy is then modified based on the values you enter in the following two fields:
Table 6-24 Create Lengths: Stretch
| Field | Description |
|---|---|
|
Increase By |
Use to specify how much to stretch the base configuration in order to create the new configuration. The value must be less than or equal to the value you enter in the Maximum Length field. The unit of measurement is agnostic. |
|
Maximum Length |
Use to specify the maximum length possible for the new configuration. The default value that is displayed is configurable during implementation. You can change the default value, but the new value must be less than or equal to the default. |
Add Bays
To add bays, select the Add Bays radio button. The add bay process creates a copy of the right-most bay, including the fixtures, shelves, pegs, and freezers. The copy is added after the last existing bay on the right. You determine the number of copies added by entering the appropriate value into the dialog box, as described in Table 6-25.
Table 6-25 Create Lengths: Add Bays
| Field | Description |
|---|---|
|
Number of Bays to Increase |
Indicates the number of bays to add. Must be an integer value. |
|
Maximum Number of Bays |
Indicates the maximum number of bays the new POG is permitted to have. This adds as many bays as indicated in the Number of Bays parameter, as long as the overall bay count for the POG does not exceed the maximum value provided for this parameter. Must be an integer value. |
Note that adding bays has the effect of increasing the number of shelves, which in turn changes the count of shelves displayed in the UI. Other metrics may also change.
Shrink
To shrink the length, select the Shrink radio button. Shrinking changes length (decrease) by eliminating starting from the last bay as many bays as defined by the Decrease Number of Bays, making sure that at least the minimum number of bays remain.
A new configuration is created that is a copy of the base configuration. The changes are made to the bays (not to the length). The copy is modified based on the values you enter in the following two fields:
Table 6-26 Create Lengths: Shrink
| Field | Description |
|---|---|
|
Decrease Number of Bays By |
Use to specify, in terms of the number of bays, how much to shrink the base configuration in order to create the new configuration. |
|
Minimum Number of Bays |
Use to specify the minimum number of bays for the new configuration. The default value that is displayed is configurable during implementation. You can change the default value, but the new value must be less than or equal to the default. |
If the values you specify are the same as those for a configuration (same parent planogram and same length), no new configuration is created. If the values you specify do not fall within the defined minimum and maximum values for shrinking or stretching, the new configuration will be defined by the minimum or maximum value instead.
The new configuration is marked for optimization automatically by the system. Other configurations with the same length are un-marked. If the new configuration is actually the same as the existing one, the existing configuration is marked for configuration.
You can make certain modifications to the run-specific POG data that is used in optimization. These modifications include adding, deleting, editing, and moving shelves associated with shelf fixtures as well as restoring prior settings.
Fixture overrides exist at the optimization level. This means that store-level optimization requires store-by-store fixture overrides and cluster level optimization requires cluster-by-cluster fixture overrides.
To make these modifications, highlight the space cluster of interest and click the Goggle icon. An empty planogram is displayed. Right-click on a shelf to access the Edit dialog box.
Figure 6-22 Edit Dialog Box for Fixture Overrides
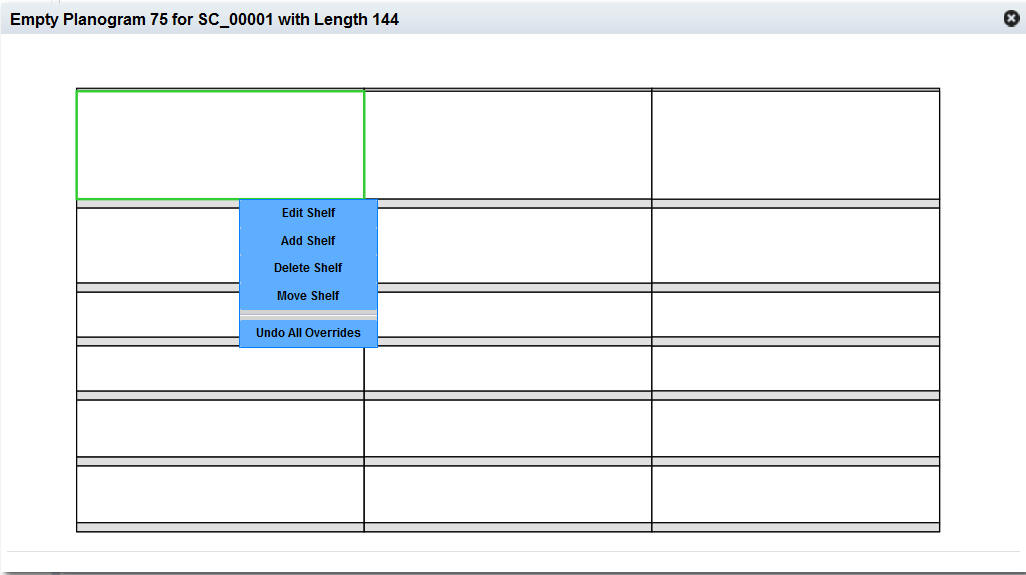
Add
You can add a new shelf to an existing fixture. To do this, select the fixture and then use the right-click menu to access the Add functionality. You see a dialog box the shows defaults. You can change the depth, thickness, and elevation of the new shelf. Note that the new shelf must fit within the existing fixture and it cannot overlap with other shelves.
Delete
You can delete a shelf from an existing fixture. To do this, select the shelf you want to delete and then use the right-click menu to access the Delete functionality. You will be asked to confirm the deletion.
After you delete the shelf, the space where the shelf existed will no longer show a shelf. If a bottom shelf was deleted, then the shelf and the space up to the next shelf (or top of fixture if no shelves) will be replaced by a grey background.
Edit
You can edit an existing shelf. To do this, click on a shelf and use the right-click menu to access the Edit functionality. You see a dialog box where you can change the depth and the thickness of the shelf.
Move
You can move an existing shelf to a new location. To do this, select the shelf you want to move and use the right-click menu to access the Move functionality. You see a dialog box that you can use to enter a new value for elevation.
Restore
You can restore a POG to the most recently loaded or updated version of that historical POG, based on the most current data feed updates made to the historical POG configuration. You cannot restore POGs that were created per macro changes. In such cases, you can delete the run and start over with the most recently loaded or updated version of that historical POG.
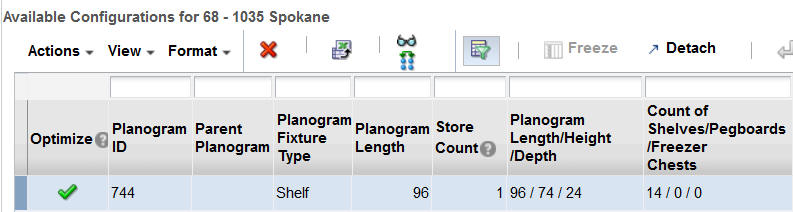
This table, shown in Figure 6-23, displays details about the configuration available for the row you select in the Locations and Planogram Lengths table. If you select more than one row, you will see the message "No Data to Display."
The Available Configurations table contains the fields listed in Table 6-27.
Table 6-27 Available Configurations
| Field | Description |
|---|---|
|
Optimize |
Indicates that the configuration is marked for optimization. |
|
Planogram ID |
The ID that identifies the configuration (planogram). |
|
Parent Planogram |
The base planogram configuration used to create the new configuration. It is always a loaded configuration. The value is Null for an externally loaded configuration. |
|
Planogram Fixture Type |
A comma-separated list of the unique fixture types in the configuration. |
|
Planogram Length |
The length of the planogram. |
|
Store Count |
The number of stores that use the configuration for this run's assortment. |
|
Planogram Length/Height/Depth |
The dimensions of the configuration. |
|
Count of Shelves/Pegboards/Freezer Chests |
Count for the number of each type of fixture that exists in the configuration. |
You can perform the following actions with respect to the Available Configurations table. You can initiate each action from the Actions menu or in some cases by clicking the appropriate icon.
Mark for Optimization
You must mark a configuration to make it available for optimization. Only marked configurations are displayed in the Results and Analysis tab. Note that only one configuration for a given length can be marked for optimization. If one configuration for a given length is currently marked for optimization, and you select another configuration of the same length, the first configuration is un-marked.
Delete
You can delete any user-created lengths (identified by non-null values in the parent Planogram column) in the table. If you delete a configuration that is marked for optimization, all configuration of that configuration's length will be deleted.
View Configuration
You can view a diagram of the selected configuration by clicking the View Configuration icon.
Compare to History
Click the Compare to History icon to see a diagram of the historical planogram used for the selected configuration.
A chart is provided that displays summary data for the planogram lengths that are being used for the optimization. This information can help you understand what the current macro space allocation is and what has been added.
Three series for this chart are available. One series shows the count of current lengths and a second series shows the count of added lengths for a given planogram length. If there are no added lengths, then the chart should only show the current lengths. The count is across all optimization locations. The total count of all current lengths should be the number of optimization locations. You can also see product heights, charted by percentage or numeric values, and representing the entire run.
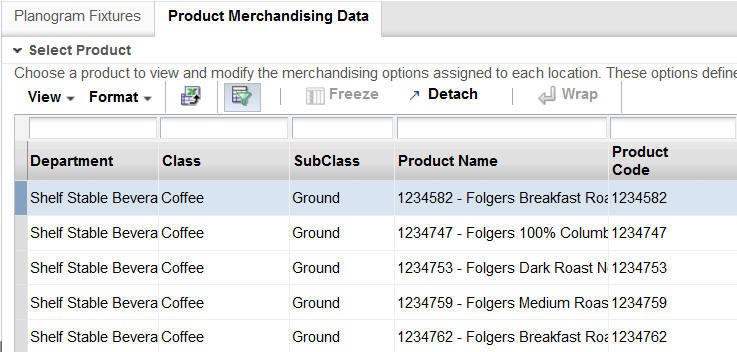
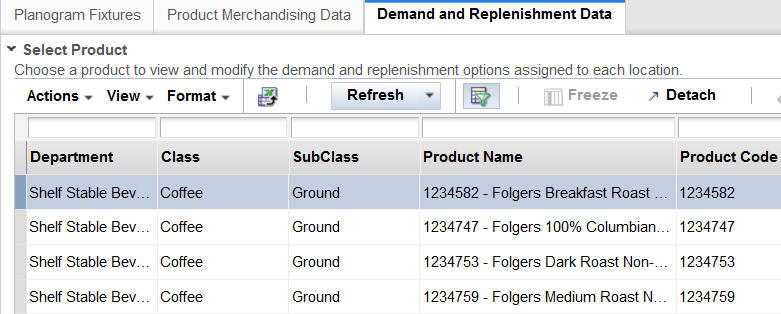
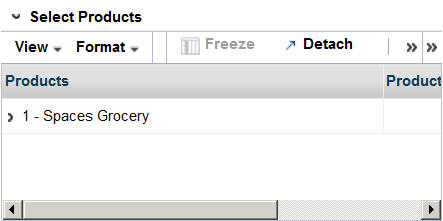
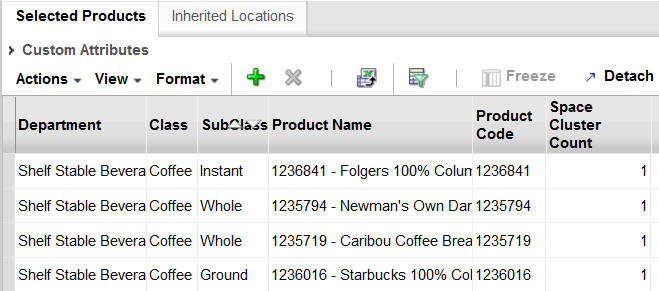
The Product Merchandise Data tab contains two main sections: The Select Products table and the Merchandising Options table. This stage addresses how products are placed on fixtures.
This table, shown in Figure 6-24, lists all available products. Each product is identified by the details of its hierarchy (level 1-3, department, class, and sub-class), as well as product name and product code.
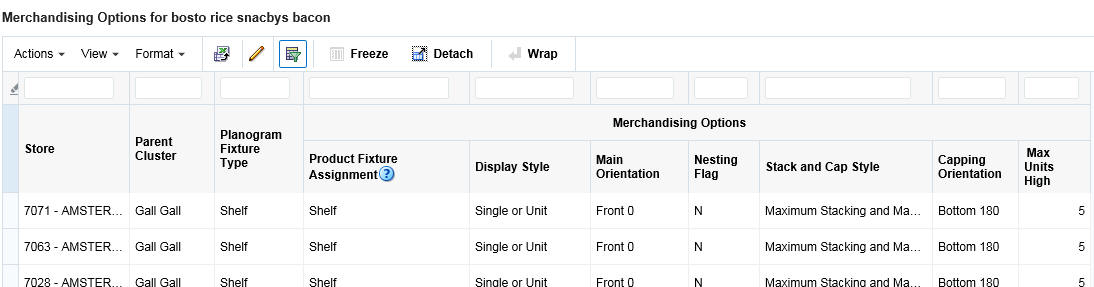
This table, shown in Figure 6-25, displays the merchandising options for all optimization locations for the product you select in the Select Product Table table. A merchandising option is the combination of fixture type, display style, main orientation, and capping orientation.
Table 6-28 lists the fields for Merchandising Options.
Table 6-28 Merchandising Options
| Field | Description |
|---|---|
|
Space Cluster/Store |
Indicates the location level for the product. |
|
Parent Cluster |
The name of the parent cluster. |
|
Planogram Fixture Type |
A comma-separated list of the unique fixture types in the configuration. |
|
Product Fixture Assignment |
The type of fixture. |
|
Display Style |
The type of display unit. |
|
Main Orientation |
How the product faces the front of the fixture. |
|
Nesting Flag |
Indicates that the product will be nested. |
|
Stack and Cap Style |
Indicates the stacking and capping style to be used for the product. |
|
Capping Orientation |
The orientation for products that are stacked. |
|
Max Units High |
Sets the limit for the number of the product units vertical height. |
You can edit the merchandising options if you have the appropriate permissions.
Select a product from the Select Product table.
Select one or more optimization locations from the Merchandising Options table.
Click the Edit icon to access the Edit Merchandising dialog box.
You see the possible options for each of the Merchandising Options that are available for the product you selected. For each option you select the Select check box in order to edit that option. The columns you can edit correspond to the columns that are displayed in the table.
The following three sections providing additional information about product merchandising. The contextual information area is located on the right side of the UI. Normally, this area is hidden to provide more room for the main frames, so you must click the small arrow in the middle of the margin to expand the section. Once the section is expanded, you will see the data elements mentioned in the contextual panel.
This table, shown in Figure 6-26, displays the sizes of the products for each of the display styles as well as the related spacing data. The data that is displayed depends on the product you select from the Select Product table. The data includes length, height, depth, finger space beside, finger space above, finger space behind, inter-product gap, and units per display style.
Finger space beside refers to the space that is needed by a specific product on the left and right side of each unit.
Finger space above refers to the space that is needed by a specific product between the top of a unit and the bottom of the shelve above it.
Finger space behind refers to the space that is needed by a specific product to the front and to the back of a unit.
This table, shown in Figure 6-27, describes the overall demand and replenishment data for the selected product. The data displayed is static and is based on the product you select from the Select Product table.
Average Demand Data. The size of the histogram bar represents the number of optimization locations.
Price. The size of the histogram bar represents the number of optimization locations.
Casepack Size. The size of the histogram bar represents the number of optimization locations.
Replenishment Frequency. The size of the histogram bar represents the number of optimization locations.
This table, shown in Figure 6-28, describes the user demand and replenishment data for the selected product and optimization location. You can use this information to help in making decisions at the lowest level. The data includes store count, APS demand, price, case pack size, replenishment frequency, Item Performance Index (IPI) score, and priority. The data displayed is based on the product you select from the Select Product table and the location you select from the Merchandising Options table.
The Demand and Replenishment Data tab lets you refresh the demand and replenishment parameters, make overrides to selected parameters, and understand the replenishment settings and their effects on results. This tab provides a Select Product table that displays all available products and a Demand and Replenishment Options table that displays the replenishment details for the product you select in the list of available products.
The Select Product table lists the available products and includes the following information about each product: Department, Class, Subclass, Product Name, and Product Code. When you select a specific product from this table, the Demand and Replenishment Options table is populated with the replenishment details for the product you select.
Action Menu
The Action menu provides access to two functions: Demand and Replenishment.
Click Demand to refresh all the underlying demand data for all the products in the current run. You see updated data derived from data feeds that occurred after the most recent run was created.
Click Replenishment to refresh all the underlying replenishment data for all the products in the current run. This action overrides any changes you have made to replenishment data.
Refresh Button
The Refresh button provides the same functionality as the Action menu.
Click Demand to refresh all the underlying demand data for all the products in the current run. You see updated data derived from data feeds that occurred after the most recent run was created.
Click Replenishment to refresh all the underlying replenishment data for all the products in the current run. This action overrides any changes you have made to replenishment data.
The Demand and Replenishment Options table displays one row for each location that carries the product you select in the Select Product table. Each row contains the aggregated data for all the stores in that optimization location.
Figure 6-30 Demand and Replenishment Options
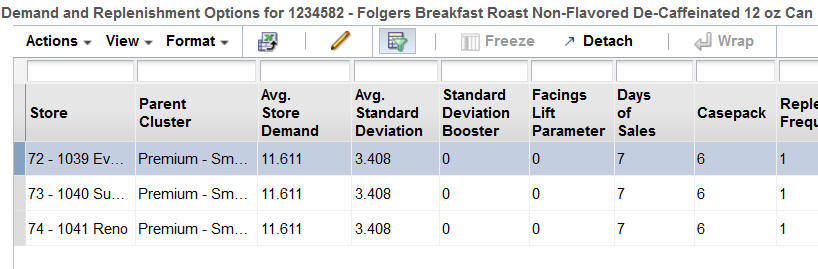
The following information is displayed:
Table 6-29 Demand and Replenishment Options Table
| Column Name | Description |
|---|---|
|
Space Cluster |
Optimizations are run at the store level or the space cluster level. A space cluster is an ad hoc group of stores with the same assortment cluster, product list, and current planogram length. |
|
Parent Cluster |
The name of the cluster that the store belongs to. |
|
Average Store Demand |
This is a weekly average. |
|
Average Standard Deviation |
A higher value indicates the need for higher safety stock to meet service levels. |
|
Standard Deviation Booster |
This is calculated across all stores in the optimization location. |
|
Facings Lift Parameter |
The impact of facings on demand. |
|
Days of Sales |
The number of days in a week that are available for store sales. |
|
Casepack |
This is calculated as a weighted average of store casepacks. It is weighed by total adjusted store demand within an optimization location. The number of units in a case. |
|
Replenishment Frequency |
The number of replenishments per shelf per week. |
|
Replenishment Type |
DC/Vendor or Backroom. |
|
Transit Time |
The number of days an order takes to go from the source location to the shelf. |
|
Replenishment Trigger |
Demand-based, target capacity-based, or case pack-based. |
|
Trigger Parameter |
Trigger value for replenishment trigger. |
Editing the Demand and Replenishment Options Table
To edit the demand and replenishment data in the table, select the row or rows containing the data you want to edit and then click Edit. You see the following dialog box.
You can edit the following fields. If you leave a field blank, then no changes will be made to that value.
Table 6-30 Edit Demand and Replenishment Data
| Field Name | Description |
|---|---|
|
Casepack |
Value must be greater than zero. |
|
Replenishment Frequency |
Value must be greater than zero. |
|
Transit Time |
Value must be greater than zero. |
|
Replenishment Trigger |
Choose from the following: Do Not Change, Cover Demand, Percent Capacity, Casepack Fit. |
|
Trigger Parameter |
Value must be a percentage greater than zero and less than or equal to 100. |
Click Save when you are finished editing the replenishment data. The data displayed in the Demand and Replenishment Options table is updated. The contextual information is also updated.
The Product Detail chart illustrates the overall demand and replenishment for the selected product. You can select the type of data to display from the drop-down menu: Average Demand Data, Standard Deviation Booster, Facings Lift Parameter, Days of Sales, Casepack Size, Replenishment Frequency, Replenishment Type, Transit Time, Replenishment Trigger, and Trigger Parameter.
The Objectives and Constraints stage is used to modify or set the constraints (business rules) for an optimization run and to display the settings associated with the run. You specify three types of optimization constraints, product level constraints, product group constraints, and planogram constraints. Even though all constraints are ultimately applied at the optimization location level, you generally set or review the data at higher location levels.
In addition, you also pick an objective for the optimization. The objective defines what metric is used as the goal of the optimization.
Once you are satisfied with all the settings in this stage, you can validate a run or submit the run for optimization. The run closes and the optimization list is displayed. When the status for the run is Complete, you can view the results.
The Summary view, shown in Figure 6-7, provides identifying information for the optimization run.
Table 6-31 Summary Section Fields
| Field | Description |
|---|---|
|
Description |
The name for the run. |
|
Created By |
The user ID of the person who has created the run. |
|
Created On |
The date when the run was created. |
|
Status |
The status of the run. Values include Setup in Progress, Running, Complete, Approved, and Finalized. |
|
Status Update |
The date when the status for the run was last updated. |
|
Optimized On |
The date when the run was last submitted for optimization. |
|
Planogram Set |
The name of the planogram set, which is selected from the Select Planogram Set dialog box. |
|
Assortment Name |
The name of the assortment associated with the planogram set. |
When you select the Summary radio button, you see the following information displayed.
This section contains four panels that display a summary of the settings.
This table, shown in Figure 6-32, lists each product constraint, along with values for the most common value, the percentage with the most common value, and the percentage of optimization locations that have the most common value. The product constraints include Inclusion, Facing Range, Capacity Range, and Elevation Range.
This table, shown in Figure 6-33, lists each planogram constraint, along with values for the most common value and the percentage of optimization locations that have the most common value. The planogram constraints include Use Visual Guidelines, Use Product Spacing, Merge Adjacent Bays, and Set Usable Space.
This table, shown in Figure 6-34, lists each type of group that is used, along with values for the total number of product group/optimization location combinations for each group and the number and percentage of optimization location that have a group of that type. The product groups include All or Nothing, Match Facings, Same Shelf, and Choose From. This table does not list product groups created at levels above the optimization location, even though those product groups may be inherited by the optimization locations.
This table, shown in Figure 6-35, lists the objective functions that are being used, along with the number and percentage of optimization locations that use each objective function. The objective functions include Maximize Sales Units, Maximize Sales Values, Maximize Margin Value, Maximize Total Sales/On Hand Value, Maximize Sales Units (Weighted), Maximize Sales Value (Weighted), Maximize Margin Value (Weighted), and Maximize Total Sales Value/On Hand Value (Weighted).
When you select the Details radio button, this section displays. It consists of two tables: Select Locations and Select Products, shown in Figure 6-36 and Figure 6-37. You must select a row from the location tree and a product row in order to display details about your selections in Objectives and Constraints details section.
The Locations table has three levels. When the first level is selected, the product constraints details across all optimization locations are displayed in the Product Constraints table. When the second level is selected, only the product constraints details for the second level location are displayed. When any optimization location is selected, only the product constraint details for the selected optimization location are displayed. In the same way, the product constrains in the Products table are displayed. So product constraint details are fetched after both the location and the product levels are select, location first and product second.
This section is used to specify optimization constraints that define the business rules that determine acceptable virtual planograms. It has five tabs; each tab displays detailed information that you can modify if you created the run.
The Product Constraints tab is shown in Figure 6-38. It includes Custom Attributes, which allow the user to select up to three attributes associated with the selected category of products. Select the attributes from the drop-down menus and click Show Attributes to add the attributes to the Product Constraints table.
For each product, it defines the current product constraints, as listed in Table 6-32.
Table 6-32 Product Constraints
| Column | Description |
|---|---|
|
Department |
Merchandise/product hierarchy node. |
|
Class |
Merchandise/product hierarchy node. |
|
Subclass |
Merchandise/product hierarchy node. |
|
Product Name |
Product identification. |
|
Product Code |
External product code. |
|
Store or Space Cluster Count |
Number of stores/space clusters that carry the product. |
|
Inclusion |
Supported inclusion values: Must keep (product must not be dropped), Can keep (product can be dropped), and Do not include (product must not be included). |
|
Capacity Range |
Type, minimum, and maximum value for capacity range. |
|
Facing Range |
Minimum and maximum value for facing range. |
|
Elevation Range |
Minimum and maximum value for elevation range. |
Click the Edit Constraints button to access the Edit Product Constraints dialog box, shown in Figure 6-39. After selecting one or more rows, you can edit the constraints if you created the run and if the run has not been submitted.
Use the drop-down lists, which contain the valid options for each constraint, to change the settings for any constraints, as appropriate. After you complete your edits, select Save from the Action menu. The system validates the changes you make and adjusts other settings as necessary. If you enter minimum and maximum values that are inconsistent, you will see an error message and must make changes before you can successfully save your edits.
The Product Groups tab, shown in Figure 6-40, is used to define parent groups, which, when defined at a location node above the optimization location, can be inherited by the optimization locations that are the children of the parent location node.
You can add, edit, or delete product groups as well as add products to and delete products from product groups. Inherited groups can also be added or deleted.
Table 6-33 Product Groups
| Column | Description |
|---|---|
|
ID |
Unique numerical identification for product group. |
|
Name |
Name of product group. |
|
Location |
Store or space cluster for product group. |
|
Constraint Type |
Values are: All or Nothing, Match Facings, Same Shelf, and Choose From. |
|
Constraint Criteria |
If Type is Choose From, values are: At Least, At Most, and Exactly. |
|
Constraint Value |
If Type is Choose From, then a numerical value is required here. |
|
Inherited Location Count |
If the product group belong to either a Level 1 or Level 2 optimization location, the product group can be copied to or referenced by Level 3 optimization locations. This column shows the count of such optimization locations. |
|
Product Count |
The number of products in the product group. |
|
Parent Group |
If this product group is created by copying or referencing an existing product group of a higher level (1 or 2) then this column shows the ID of parent product group. |
|
Errors |
Number of errors for product group. |
|
Warnings |
Number of warnings for product group. |
Selected Products
Use this section, shown in Figure 6-41 to add or remove products from a selected product group.
You can see and use the product attributes by accessing the Custom Attributes dialog box shown in Figure 6-42 when you are creating product groups. When you make a selection, the Product Groups table is populated.
Inherited Locations
Use this section, shown in Figure 6-43, to add or remove inherited locations.
Visual Guidelines provide product attribute-based vertical and horizontal blocking for placing products on a shelf fixture planogram. You are allowed up to four levels for the blocking criteria. The visual guidelines can be created at the top level (All Locations) for each fixture type; the optimization locations inherit this. In addition, you can edit or modify the optimization location level visual guideline; if you do this, the link to the parent is broken. Each optimization location can have only one visual guideline for a fixture type. You can add, delete, and edit the visual guidelines.
Blocking is defined as horizontal or vertical. Vertical is the default. You can specify primary and secondary blocking criteria. The secondary blocking is optional. If the primary blocking is vertical then the secondary blocking is horizontal; if the primary blocking is horizontal then the secondary blocking is vertical. Horizontal blocking supports pegboards.
Primary and secondary blocking can have up to two attributes each. Each attribute for a specific blocking strategy is defined in the same way, horizontal or vertical. A sequence number is assigned to each attribute value for each blocking level. The sequence numbers determine the order of the blocks. In ascending order, the blocks are positioned from top to bottom (horizontal) and left to right (vertical). When two are blocks are assigned the same sequence number, the blocks are combined (merged).
Example 1:
Primary blocking: Vertical blocking by brand.
Merge blocks: Brand A, Brand B, and Brand C
Additional primary blocking: Vertical blocking by type.
Secondary blocking: Horizontal blocking by size for all vertical blocks.
Example 2:
Primary blocking: Horizontal blocking by size.
Additional primary blocking: Horizontal blocking by flavor.
Secondary blocking: Vertical blocking by brand for all vertical blocks.
Visual Guidelines Table
The Visual Guidelines table provides information about each visual guidelines row.
The columns for this table are described in Table 6-34.
Table 6-34 Visual Guidelines
| Column | Description |
|---|---|
|
Space Cluster/Store |
The name of the optimization location. |
|
Parent Cluster |
The name of the parent cluster for the optimization location. |
|
Description |
The name of the visual guideline. |
|
Primary Blocking Strategy |
Vertical or horizontal. |
|
Primary Attribute |
The product attribute used. |
|
Primary Blocks |
The first block used for the configuration |
|
Inherited Location Count |
The number of space clusters or stores that inherit the parent visual guidelines. |
|
Parent VG Cluster |
The ID of the parent visual guideline cluster. |
The Primary Block Details table provides additional information.
Table 6-35 Primary Block Details
| Column | Description |
|---|---|
|
Shared Configuration |
Indicate whether or not two attributes share the same configuration. |
|
Primary Attribute Value |
Primary attribute. |
|
Block Sequence |
Defines the block and the sequence for that block. |
|
Merge Sequence |
Blocks with the same merge value are combined. |
|
Product Count |
The number of products in the block. |
|
Sales Units |
The average sales units for products in the block. |
|
Sales Revenue |
The average sales revenue for products in the block. |
|
Additional Primary Attribute |
Additional primary attribute. |
|
Secondary Attribute |
Secondary attribute. |
|
Additional Secondary Attribute |
Additional secondary attribute. |
Adding Visual Guidelines
You can add visual guidelines through the Add Visual Guidelines dialog box. You access this by selecting the Detail radio button and clicking the Add icon.
To add visual guidelines, complete the following steps:
Enter the description of the visual guideline in the Description text box.
Select the primary blocking strategy, horizontal or vertical, from the Primary Blocking Strategy drop-down list.
Select the attribute to use for blocking from the Attribute drop-down list. This populates the table with the attribute values. At this point, the values for all sequences are assigned a default value of 1.
Define the attribute sequence number for each attribute by selecting a value from the drop-down list in the Block Sequence column. This defines the block and the sequence for the block. To define merged blocks, assign the same value to each attribute to be merged.
Optionally, define the merge sequence value by selecting a value from the drop-down list in the Merge Sequence column. This functionality is only enabled if you have assigned the same sequence number to two of the primary blocks.
Choose locations from Selected Locations.
Optionally, prior to saving the primary blocking, you can specify the advanced blocking. To do this, select the attribute value in the table and click the Pencil icon. You see the Advanced Blocking dialog box.
After the primary blocking strategy and attribute are defined, the primary block can be configured. When primary blocking is vertical, then horizontal blocking is specified for each primary block. When primary blocking is horizontal, then vertical blocking is specified for each primary block.
When two attributes have the same sequence number, they share the same configuration. If you change one of the attribute's block sequence numbers to an unassigned number, it still maintains that configuration. If you change the attribute's block sequence number to an assigned number, then it takes the new configuration of the block it joins.
The Use Same Advanced Blocking across all Primary Blocks check box functions in different ways, depending on the following:
When the primary blocking strategy is vertical, the check box is enabled. Check this box if you want all of the primary blocks to share the same secondary and additional blocking. If you do not check this box, then each primary block is configured separately.
When the primary blocking strategy is horizontal, the check box is disabled. When two or more attributes share the same sequence number, all the products that have these attributes are combined.
To configure Additional Primary Blocking, select the attribute from the drop-down list. The table populates with the attribute values. All sequence numbers default to a value of 1. If you select None for the attribute, then blocking at this level is disabled.
Define the attribute sequence for each attribute value by selecting the sequence number from the drop-down list in Block Sequence. If you assign the same sequence number to more than one attribute, then all the products with these attributes are combined.
To configure Secondary Blocking, select the attribute from the drop-down list. The table populates with the attribute values. All sequence numbers default to a value of 1. If you select None for the attribute, then blocking at this level is disabled.
Define the attribute sequence for each attribute value by selecting the sequence number from the drop-down list in Block Sequence. If you assign the same sequence number to more than one attribute, then all the products with these attributes are combined.
You can only configure Additional Secondary Attributes if you have configured Secondary Blocking. To configure Additional Secondary Attributes, select the attribute from the drop-down list. The table populates with the attribute values. All sequence numbers default to a value of 1. If you select None for the attribute, then blocking at this level is disabled.
Define the attribute sequence for each attribute value by selecting the sequence number from the drop-down list in Block Sequence. If you assign the same sequence number to more than one attribute, then all the products with these attributes are combined.
Click OK. The Add Visual Guidelines table is updated with the selected attributes.
Click Save to save the configuration. This overwrites any existing visual guidelines configuration for the selected location.
You can use Visual Guidelines to specify visual guidelines at higher location levels and have space clusters or stores inherit the visual guidelines. For this, you must select a node higher than lowest level in the Locations tab at the top. To specify which space clusters will inherit this visual guideline, select the appropriate space clusters while adding or editing the visual guidelines.
Consider the example shown in Figure 6-47. Two visual guidelines are created at two higher-level nodes: All Locations and AHBaarnII. During the process of adding or editing the visual guidelines, the user has selected different space clusters to inherit this higher-level rule. For example, space clusters SC_00002 and SC_00003 inherit the VG created at All Locations (primary attribute = Coffee Tea-Classification), and SC_00001 inherits the All Locations visual guidelines (primary attribute = Coffee Tea-Flavor).
Editing Visual Guidelines
You can modify the characteristics of a visual guideline through the Edit Visual Guidelines dialog box. Select a row to indicate which guideline you want to edit and click the Pencil icon. You see the Edit Visual Guidelines dialog box.
You can modify any values except the Primary Blocking Strategy and the Primary Attributes following same approach you use to create those values. Once you have completed making changes, click Save to save your changes and update the Visual Guidelines table. You can click the Cancel button to cancel the edits.
The Family Groups & Sorting tab, shown in Figure 6-49, is used to define parent product family groups and sort order. These can, when defined at a location node above the optimization location, be inherited by the optimization locations that are the children of the parent location node. In addition, you can define product family group and sort order at the planogram level or at any block level. The hierarchy for how rules are applied to optimization is: All Blocks, Primary (Additional Primary), and Secondary (Additional Secondary). The lower level product family group and sort order are given priority compared to a product family group (PFG) and sort order specified at a higher-level. For example, a user defines one PFG & Sort Order at the all blocks level (or planogram- level) and another at a specific Primary Block level. Then, except for the primary block and its children that were specified as a separate PFG & Sort Order, all other primary blocks (and children) will receive the planogram-level specification. In other words, you can manage the product family group and sort order by exception: Apply the global PFG and Sort order except for this one specific primary block and its children.
You can add, edit, or delete family groups and sort order as well as specify which space clusters will inherit the product family group and sort order. This panel displays all the family groups defined, and at what location level, for which fixture type and at what block level. It also shows whether the family group and sorting defined at a particular block level is valid or not (for example, the underlying block was deleted for some reason after family group and sorting is defined).
Table 6-36 Family Group and Sort Order
| Column | Description |
|---|---|
|
Product Family Group and Sorting ID |
Unique numerical identification for product family group and sort order. |
|
Name |
Name of product family group and sort order. |
|
Location |
Store or space cluster for product family group and sort order. |
|
Fixture Type |
Fixture type can be shelf, pegboard or freezer chest. |
|
Inherited Location Count |
If the product family group and sort order belongs to either a Level 1 or Level 2 optimization location, the product family group and sort order can be copied to or referenced by Level 3 optimization locations. This column shows the count of such optimization locations. |
|
Parent Group |
If this product family group and sort order is created by copying or referencing an existing product family group and sort order of a higher level (1 or 2), then this column displays the ID of the parent product family group and sort order. |
|
Primary Attribute Value |
If the family group and sort order is defined for a primary block, then this will be the list of all attribute values (comma separated). |
|
Additional Primary Attribute Value |
If the family group and sort order is defined for an additional primary block, then this will be the list of all attribute values (comma separated). |
|
Secondary Attribute Value |
If the family group and sort order is defined for a secondary block, then this will be the list of all attribute values (comma separated). |
|
Additional Secondary Attribute Value |
If the family group and sort order is defined for an additional secondary block, then this will be the list of all attribute values (comma separated). |
When you click the Add (or Edit) Product Family Group and Sort Order link, it opens a pop-up where you can specify the fixture type, block-level at which rule will be defined, and the sequence of attributes and order of attribute values.
Use this panel to examine the attributes and the sort order specified for the selected product family group and sort order. The sequence refers to the order in which attributes are applied. The sort order can be ascending (ASC), descending (DESC), or custom (CUSTOM). This defines how products are to be arranged, based on the order of attributes values. Custom indicates the order of the attribute values is determined by the user. For example, if a user wants to group first by brand and then by flavor, then brand would be assigned a sequence of 1 and flavor a sequence of 2. If there are three brands, Lindt, Hersheys and Cadburys, then ascending order is Cadburys, Hersheys and Lindt. This indicates to ASO that products are to be arranged first by brand and then by flavor and then, within brand, by the specified order.
The Planogram Constraints tab, shown in Figure 6-52, displays a list of optimization locations along with values for four constraints: Use Visual Guidelines, Use Product Spacing, Merge Adjacent Bays, and Set Usable Space.
Service levels can be defined at the planogram level using the Planogram Constraints screen.
You can edit these constraints by selecting the row or rows whose settings you want to change and then click Edit Constraints. You see the dialog box shown in Figure 6-53.
Use the drop-down menus to select a new setting. For Set Usable Space, you must enter a value between 1% and 100%. Select Do Not Change if you do not want to change a particular constraint. Click Save to save your changes.
Table 6-37 Planogram Constraints
| Column | Description |
|---|---|
|
Space Cluster/Store |
The name of the optimization location. |
|
Parent Cluster |
The name of the parent cluster for the optimization location. |
|
Use Visual Guidelines |
Indicates whether or not to use visual guidelines. Values are Yes and No. |
|
Use Product Family Group |
Indicates whether or not to use Product Family Group and Sort Order constraints. Values are Yes and No. |
|
Use Product Spacing |
Indicates whether or not to use product spacing. Values are Yes and No. |
|
Merge Adjacent Bays |
Indicates whether or not to merge adjacent bays. Values are Yes and No. The optimization process provides the option of merging adjacent bays. |
|
Set Usable Space |
A value between 1 and 100 that indicates the usable space. available to the optimization process. A values less than 100 forces the optimization process to leave some fixture space unused for aesthetic or other reasons. |
The Optimization Objectives table, shown in Figure 6-54, includes:
Maximize Sales Units. This tells the optimization to fill the planogram with items that will result in best possible sales units for selected items/facings.
Maximize Sales Revenue. For an item, sales revenue is calculated as price times the sales units. This tells the optimization to fill the planogram with items that will result in the best possible sales revenue for selected items/facings.
Maximize Gross Profit. For an item, gross profit is obtained by multiplying the difference between price and cost, and sales units. This tells the optimization to fill the planogram with items that will result in the best possible gross profit for selected items/facings.
Maximize Sales Revenue/On Hand Units. For each item, the ratio is calculated and added together. This objective tells the optimization to fill the planogram with items that result in the best possible revenue for the inventory units carried for each item.
Maximize Gross Profit Return on Investment. This objective tells the optimization to fill the planogram with items that result in the best possible total profit, but that at the same time minimize the total inventory cost at the planogram-level. As one can imagine, carrying too much inventory will result in higher revenues or profits but at a higher cost of carrying more inventory. This metric lets the user strike a balance between these two metrics. There are two versions supported: the generic version in which the user is unable to provide the store-level inventory. To use the generic version GENERIC_GMROI_FLG is set to 'Y' in RSE_CONFIG.
Maximize Sales Units (Weighted). This objective is similar to 'Maximize Sales Units' except that here each item's contribution to objective is weighted by the IPI values provided by CMPO.
Maximize Sales Revenue (Weighted). This objective is similar to 'Maximize Sales Revenue' except that here each item's contribution to objective is weighted by the IPI values provided by CMPO.
Maximize Gross Profit (Weighted). This objective is similar to 'Maximize Gross Profit' except that here each item's contribution to objective is weighted by the IPI values provided by CMPO.
Maximize Sales Revenue/On Hand Units (Weighted). This objective is similar to 'Maximize Sales Revenue/On Hand Units' except that here each item's contribution to objective is weighted by the IPI values provided by CMPO.
Maximize Gross Profit Return on Investment (Weighted). This objective is similar to Maximize Gross Profit Return on Investment except that here each item's contribution to the objective (in the numerator and denominator) is weighted by the IPI values provided by CMPO.
Weighted objectives are weighed using the IPI values provided by CMPO.
Select one or more rows in order to modify specific objectives using the Apply button.
Each of the five tabs within the Objectives and Constraints stage have associated contextual information. The information is displayed based on the selections you make in the location hierarchy table.
The Product Constraints information includes:
Constraint Values, which displays a list of the constraints and associated metrics
Constraint Charts, which provide a summary for each constraint
Product Details
Product Groups information includes:
Product Group Summary, which displays counts for the group types
Product Lookup, which shows, for a given product, the associated group ID, group name, and group type
Visual Guidelines information includes:
Visual Guidelines Summary, which includes an Attributes histogram for each attribute, and Attributes Group histogram
Attributes Lookup, which provides details about product counts for individual attributes
Visual Guidelines Detail, which analyzes attribute values and product counts by sequence number
Planogram Constraints information includes:
Constraint Charts, which provide summaries for each constraint
Planogram Space, which can help you understand the relationship between the available space and the set of products.
Optimization Objectives information includes:
Optimization Objectives
Product Details, which includes details for IPI values, price, and margin percentage
After the optimization run is complete, the results are displayed in the Results and Analysis stage. You can see summary performance data and view planograms for the optimization runs. In this stage, you can make a limited number of overrides to the table view or the planogram view. Substantive changes require that you re-configure settings and complete another optimization run.
The results are displayed in two tables. The upper table displays the total optimized performance. The data is summed for all the stores in a space cluster. You can access the virtual planogram by clicking the View Planogram icon. The lower table displays detailed results with product-level data. The data you see is the average for store numbers, not totals for space clusters.
You can drop products from the lower table for one or more locations; these dropped products are listed in a table.
Alerts are also provided, along with supporting metrics.
Actions To Take
From the Results and Analysis stage, you can:
Revisit earlier stages in order to make changes to various settings and then re-submit the optimization. You can also validate a run in order to look for constraints that produce errors or warnings. See Validation for more details.
Copy and save the run using the Save As functionality in the Action menu. Use the copy to make changes and then compare the results.
Approve the run and make it available for assortment analysis.
Leave the run in the optimization list without taking any actions. You cannot delete the run; you must be in Optimization List in order to delete a run.
The Optimization Results table is shown in Figure 6-55.
You can toggle between a tree view and a table view to examine the results. The tree view displays the results hierarchically. The results are either a sum of lower level values, an average of lower level values, or a distinct count.
Table 6-39 Optimization Results
| Field | Description |
|---|---|
|
Space Cluster/Store |
The name of the optimization location: Store or Space Cluster. |
|
Optimization Locations |
The number of optimization locations. |
|
Store Count |
The number of distinct stores for a given level. |
|
Planogram Length |
A comma-separated list of selected planogram lengths |
|
Total Lengths |
The total count of planogram lengths for which the optimization was run. If more than one total is displayed, you can click the number to access a pop-up window. You can modify selected planogram lengths for the specified optimization location. |
|
Available Products |
A count of the available products for a given space cluster level. |
|
Included Products |
A count of the included products in an assortment for a given space cluster level. |
|
Sales Units |
The value for sales units in the optimization results. This value is aggregated at higher levels by summing the values for the lower levels. |
|
Sales Value |
The value for sales. This value is aggregated at higher levels by summing the values for the lower levels. |
|
Margin Value |
The value for margin. This value is aggregated at higher levels by summing the values for the lower levels. |
|
Lost Sales Units |
The value for lost sales units. This value is aggregated at higher levels by summing the values for the lower levels. |
|
GMROI |
This is the value of Gross Margin Return on Investment. This value is aggregated at higher levels by taking a ratio of the sum of margin at lower levels and sum of inventory cost at lower levels |
|
Service Level |
The value for the service level. The value is aggregated at higher levels by averaging the values for the lower levels. |
|
Alerts |
The number of alerts. This value is aggregated at higher levels by summing the values for the lower levels. |
|
Overrides |
The number of user overrides. This value is aggregated at higher levels by summing the values for the lower levels. |
The Included Products table lists metrics at various levels of aggregation. You can select specific products from the table and click the Delete button in order to remove them from the results. You see a list of the products you want to delete and are prompted to confirm the action.
The Dropped Products table, shown in Figure 6-56, lists all the products that have been dropped per optimization process rules including but not limited to user override action or if the inclusion product constraint is set to Do Not Include. This panel functions like a simplified pivot table so you can pivot on the columns in the panel. In addition, you can also click on Export to Excel to export the list of dropped products.
The Alerts table, in Figure 6-57, shows the metrics provided for alerts.
The Used Space Percent can help you see if there is too much open space.
The Dropped Products Percent and Dropped Products Count can help you see if too many products were eliminated from an assortment.
The Service Level Value and Service Level Units can help you understand stockout levels.
You can configure the following parameters to control the thresholds for the alerts.
Table 6-40 Alerts Parameters
| Parameter Name | Description |
|---|---|
|
ALRT_LESS_THAN_PCT_USED_SPACE |
An alert will be triggered if the run optimization results use less space than the value specified by this global parameter. |
|
ALRT_LESS_THAN_SERVICE_LEVEL_AMT |
An alert will be triggered if the run optimization results have a sales service level lower than he value specified by this parameter. |
|
ALRT_LESS_THAN_SERVICE_LEVEL_QTY |
An alert will be triggered if the run optimization results have a quantity service level lower than he value specified by this parameter. |
|
ALRT_MORE_THAN_CNT_PRODUCT_DROPPED |
An alert will be triggered if the run optimization results dropped more products than he value specified by this parameter. |
|
ALRT_MORE_THAN_PCT_PRODUCT_DROPPED |
An alert will be triggered if the run optimization results dropped a percentage of product higher than he value specified by this parameter. |
The Results and Analysis stage provides summary information about sales units, sales value, service level, and included products.
Results Summary
Inclusion Summary
When you click the View Results icon, you see a pop-up window displaying a planogram your run. Depending on your permissions, you can edit the planogram.
Selection View
Left-click a facing to highlight it.
Fixture Details
When you mouse over a fixture, the following information is displayed: fixture type, length, depth, and elevation.
Product Details
When you mouse over a product, the following information is displayed: product name, product code, facing count, facing ID, display style, main orientation, dimensions, stacking option, and elevation. When applicable, visual guideline information such as the attribute values used for the four levels of blocking are shown. Similarly, when applicable, the family group and sort order definition, such as the attributes used (in the order defined) and the attribute values (in the order defined) are shown.
When you right-click a facing to select it, you have access to the following actions: editing facings, add, delete, move, save changes, cancel changes, and undo all changes.
Figure 6-59 Virtual Planogram with Action Menu
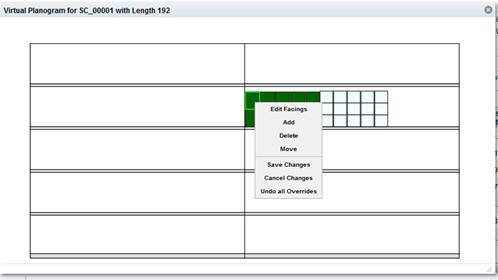
Use this action to delete a product. Deleted products can be added back using the Add Products action.
When you select this action, you see a list of product codes for dropped products from which to choose. The product you select is restored to its original position and with the same number of facings as when it was dropped.
Click the Compare to History button to view a historical planogram. Such planograms cannot be modified.
The historical planogram contains colored rectangles representing products. You can change the color mapping in the historical planogram and select images of products (if available). To do this, click the Color button. You see the Color Mapping pop-up, from which you can choose one of the following color mappings:
Product ID (the default)
Product Image
Capping is an alternative way of defining the top layer(s) of a product on a shelf after the bottom layer(s) has been placed. Capping layers may differ from the corresponding bottom layers, in both numbers of rows and columns as well as the individual dimensions.The VPOG pop-up displays the applicable capping layers. It also provides capping information in the hover pop-up. This only occurs when the style indicates capping, and it is applicable to the whole product display style, independent of the hover location. The following capping information is shown:
Capping Facing Count. The horizontal facing count for the capping layer.
Capping Height Facing Count. The depth facing count for the capping layer.
Capping Depth Facing Count. The depth facing count for the capping layer.
Capping Dimensions. Product dimensions for the corresponding capping layer.
Capping Elevation. Elevation of the corresponding capping layer.
Capping Orientation. Orientation of the corresponding capping layer.
Figure 6-60 provides an example of the VPOG hover pop-up.
You can change the colors of the displayed boxes or display product images in the virtual planogram. To do this, click the Color button.
You see the Color Mapping pop-up, from which you can choose the color mapping you want:
Product ID (the default)
Primary Attribute Value–The coloring of products (rectangle boxes) is based on the primary attribute values.
All Visual Guidelines–In this selection, the coloring is by the complete blocking criteria: Primary Attribute Value, Additional Primary Attribute Value, Secondary Attribute Value, and Additional Secondary Attribute Value. If you do not specify any level, it will display as null, as shown in Figure 6-63.
Product Image
You can validate your data and constraint settings within each stage of Execute Space Optimization by using the Validate option in the Action menu. Validation lets you identify problems with potential data or constraints prior to initiating a complete optimization run. The Validate functionality is enabled after you create a run, provide it with a name, and populate it with a POG set and a group of stores or clusters. The Validate functionality is disabled for a run once it has a status of Finalized or Approved.
The validation process provides you with a quick way to determine if an optimization problem has any obvious incorrect data or parameters before you submit a run and request an optimization result. The process is not designed to find all possible errors or warnings, as some infeasible scenarios are only identifiable by the optimization process itself. However, the validation does provide you with the opportunity to find potential issues, and to then navigate back to the Fixture and Product Data or Objective and Constraints stage in order to address the setup issues. This can help you avoid submitting a run for optimization and then discovering that changes are required.
The validation process checks on issues with price, cost, demand and replenishment data. Specifically it looks for invalid values, missing data and generates an error or warning, depending on whether the product is mandatory or optional. Except for replenishment data which can also be modified in the UI, other data issues will require the user to correct and re-load the data interface files.
Validation identifies two types of conflict:
Errors. Identifies data or constraints that prevent an optimization from completing successfully. You must correct all errors before you execute the run.
Warnings. Identifies data or constraints that you may want to review and possibly change. Warnings do not necessarily cause the optimization to fail but can have unwanted consequences in terms of the results. Thus, it is always a good practice to review the warnings before clicking Submit.
If the validation you request finds errors or warnings, you will see an error icon in the Summary area of the stage you are in. Some validation checks only apply to shelf fixtures while others apply to both shelves and pegboards. To view the details, expand the Validation Errors and Warning section below the Summary section. Click each link in order to display the Details for Validation Errors and Warnings dialog box, which contains information explaining the error or warning that can help you address the problem.
Warnings are informational and indicate that optional items will be handled according to the constraints you set. Here is a list of possible warnings and suggested optional actions to address the warnings.
Table 6-41 Warnings and Suggested Actions
| Alert # | Warning Description | Suggested Optional Action |
|---|---|---|
|
201 |
Optional product in all or nothing group becoming effective mandatory. |
No fix needed. |
|
202 |
Optional choose from product becoming effective mandatory. |
No fix needed. |
|
209 |
Optional product becoming effective drop. |
No fix needed. |
|
211 |
Optional product too wide. |
Reduce the minimum number of facings or change the elevation or orientation. |
|
212 |
Optional product too tall. |
Change the elevation or orientation. |
|
213 |
Optional product lacks shelf. |
Change the elevation. |
|
232 |
No common set of shelves. |
Edit the group settings or elevation ranges. |
|
236 |
No common facing value |
Edit the group settings or facing ranges. |
|
1000 |
Product price is 0 or negative for (all) the store(s) |
Optional: Re-load so_assort_proloc_pricecost_stg.txt file with valid prices otherwise the product will be dropped |
|
1001 |
Product price is 0 or negative for some stores |
Optional: Re-load so_assort_proloc_pricecost_stg.txt file with valid prices otherwise the product will be incorrectly valued/dropped as affected stores are discarded |
|
1002 |
Product cost is 0 or negative for (all) the store(s) |
Optional: Re-load so_assort_proloc_pricecost_stg.txt file with valid costs otherwise the product will be dropped |
|
1003 |
Product cost is 0 or negative for some stores |
Optional: Re-load so_assort_proloc_pricecost_stg.txt file with valid costs otherwise the product will be incorrectly valued as affected stores are discarded |
|
1004 |
Product price and cost are equal for (all) the store(s) |
Optional: Re-load so_assort_proloc_pricecost_stg.txt file with valid prices or costs otherwise the product will be dropped |
|
1005 |
Product price and cost are equal for some stores |
Optional: Re-load so_assort_proloc_pricecost_stg.txt file with valid prices or costs otherwise the product will be incorrectly valued/dropped as affected stores are discarded |
|
1006 |
Product cost is greater than the price for (all) the store(s) |
Optional: Re-load so_assort_proloc_pricecost_stg.txt file with valid prices or costs otherwise the product will be dropped |
|
1007 |
Product cost is greater than the price for some stores |
Optional: Re-load so_assort_proloc_pricecost_stg.txt file with valid prices or costs otherwise the product will be incorrectly valued/dropped as affected stores are discarded |
|
1008 |
Product demand is 0 or negative for (all) the store(s) |
Optional: Re-load so_assort_proloc_fcst_stg.txt file with valid demand values otherwise the product will be dropped |
|
1009 |
Product demand is 0 or negative for some stores |
Optional: Re-load so_assort_proloc_fcst_stg.txt file with valid demand values otherwise the product will be incorrectly valued/dropped as affected stores are discarded |
|
1010 |
Missing price, cost, and demand data for (all) the store(s) |
Optional: Re-load the so_assort_proloc_pricecost.txt and so_assort_proloc_fcst.txt files with valid data otherwise the product will be dropped |
|
1011 |
Missing price, cost, and demand data for some stores |
Optional: Re-load the so_assort_proloc_pricecost.txt and so_assort_proloc_fcst.txt files with valid data otherwise the product will be incorrectly valued/dropped as affected stores are discarded |
|
1012 |
IPI value is 0 or negative for (all) the store(s) |
Optional: Re-load so_assort_product_strcltr_stg.txt with valid IPI values otherwise the product will be dropped |
|
1013 |
IPI value is 0 or negative for some stores |
Optional: Re-load so_assort_product_strcltr_stg.txt with valid IPI values otherwise the product will be incorrectly valued/dropped as affected stores are discarded |
|
1014 |
Casepack value is 0 or negative for (all) the store(s) |
Optional: Change casepack data through UI or by re-loading so_prod_loc_repl_param_stg.txt file with valid values otherwise product will be dropped |
|
1015 |
Casepack value is 0 or negative for some stores |
Optional: Change casepack data through UI or by re-loading so_prod_loc_repl_param_stg.txt file with valid values otherwise product will be dropped |
|
1016 |
Product inventory cost is 0 or negative for (all) the store(s) |
Optional: Re-load so_assort_proloc_pricecost_stg file with valid inventory cost otherwise the product may be incorrectly valued/dropped |
|
1017 |
Product inventory cost is 0 or negative for some stores |
Optional: Re-load so_assort_proloc_pricecost_stg file with valid inventory cost otherwise the product may be incorrectly valued/dropped as affected stores are discarded |
|
1018 |
Product store inventory is 0 or negative for (all) the store(s) |
Optional: Re-load so_assort_proloc_pricecost_stg file with valid inventory quantity otherwise the product may be incorrectly valued/dropped |
|
1019 |
Product store inventory is 0 or negative for some stores |
Optional: Re-load so_assort_proloc_pricecost_stg file with valid inventory quantity otherwise the product may be incorrectly valued/dropped as affected stores are discarded |
|
1100 |
Mandatory product price is 0 or negative for (all) the store(s) |
Re-load so_assort_proloc_pricecost_stg.txt file with valid prices otherwise the product will be dropped or make the product optional |
|
1101 |
Mandatory product price is 0 or negative for some stores |
Optional: Re-load so_assort_proloc_pricecost_stg.txt file with valid prices otherwise the product will be incorrectly valued/dropped as affected stores are discarded |
|
1102 |
Mandatory product cost is 0 or negative for (all) the store(s) |
Re-load so_assort_proloc_pricecost_stg.txt file with valid costs otherwise the product will be dropped or make the product optional |
|
1103 |
Mandatory product cost is 0 or negative for some stores |
Optional: Re-load so_assort_proloc_pricecost_stg.txt file with valid costs otherwise the product will be incorrectly valued as affected stores are discarded |
|
1104 |
Mandatory product price and cost are equal for (all) the store(s) |
Re-load so_assort_proloc_pricecost_stg.txt file with valid prices or costs otherwise the product will be dropped or make the product optional |
|
1105 |
Mandatory product price and cost are equal for some stores |
Optional: Re-load so_assort_proloc_pricecost_stg.txt file with valid prices or costs otherwise the product will be incorrectly valued/dropped as affected stores are discarded |
|
1106 |
Mandatory product cost is greater than the price for (all) the store(s) |
Re-load so_assort_proloc_pricecost_stg.txt file with valid prices or costs otherwise the product will be dropped or make the product optional |
|
1107 |
Mandatory product cost is greater than the price for some stores |
Optional: Re-load so_assort_proloc_pricecost_stg.txt file with valid prices or costs otherwise the product will be incorrectly valued/dropped as affected stores are discarded |
|
1108 |
Mandatory product demand is 0 or negative for (all) the store(s) |
Re-load so_assort_proloc_fcst_stg.txt file with valid demand values otherwise the product will be dropped or make the product optional |
|
1109 |
Mandatory product demand is 0 or negative for some stores |
Optional: Re-load so_assort_proloc_fcst_stg.txt file with valid demand values otherwise the product will be incorrectly valued/dropped as affected stores are discarded |
|
1110 |
Mandatory product missing price, cost, and demand data for (all) the store(s) |
Re-load the so_assort_proloc_pricecost.txt and so_assort_proloc_fcst.txt files with valid data otherwise the product will be dropped or make the product optional |
|
1111 |
Mandatory product missing price, cost, and demand data for some stores |
Optional: Re-load the so_assort_proloc_pricecost.txt and so_assort_proloc_fcst.txt files with valid data otherwise the product will be incorrectly valued/dropped as affected stores are discarded |
|
1112 |
Mandatory product's IPI value is 0 or negative for (all) the store(s) |
Re-load so_assort_product_strcltr_stg.txt with valid IPI values otherwise the product will be dropped or make the product optional |
|
1113 |
Mandatory product's IPI value is 0 or negative for some stores |
Optional: Re-load so_assort_product_strcltr_stg.txt with valid IPI values otherwise the product will be incorrectly valued/dropped as affected stores are discarded |
|
1114 |
Mandatory product's casepack value is 0 or negative for (all) the store(s) |
Change casepack data through UI or by re-loading so_prod_loc_repl_param_stg.txt file with valid values otherwise product will be dropped or make the product optional |
|
1115 |
Mandatory product's casepack value is 0 or negative for some stores |
Optional: Change casepack data through UI or by re-loading so_prod_loc_repl_param_stg.txt file with valid values otherwise product will be incorrectly valued/dropped as affected stores are discarded |
|
1116 |
Mandatory product inventory cost is 0 or negative for (all) the store(s) |
Optional: Re-load so_assort_proloc_pricecost_stg file with valid inventory cost otherwise the product may be incorrectly valued |
|
1117 |
Mandatory product inventory cost is 0 or negative for some stores |
Optional: Re-load so_assort_proloc_pricecost_stg file with valid inventory cost otherwise the product will be incorrectly valued as affected stores are discarded |
|
1118 |
Mandatory product store inventory is 0 or negative for (all) the store(s) |
Optional: Re-load so_assort_proloc_pricecost_stg file with valid inventory quantity otherwise the product may be incorrectly valued |
|
1119 |
Mandatory product store inventory is 0 or negative for some stores |
Optional: Re-load so_assort_proloc_pricecost_stg file with valid inventory quantity otherwise the product will be incorrectly valued as affected stores are discarded |
Once you have made corrections to the errors, you must run Validate again in order to make sure that all the errors have been corrected. Here is a list of possible errors and recommended corrections.
Table 6-42 Errors and Recommended Solutions
| Alert # | Error Description | Recommended Solution |
|---|---|---|
|
101 |
Mandatory product too wide. |
Reduce minimum number of facings, change product orientation, or make the product optional. |
|
102 |
Mandatory product too tall. |
Change the product orientation or make the product optional. |
|
103 |
Mandatory product lacks shelf. |
Change the elevation setting or make the product optional. |
|
106 |
Mandatory products combined width too wide for shelf. |
Reduce the minimum facings or make some of the products optional. |
|
107 |
Mandatory products combined area too large for pegboard. |
Reduce the minimum facings or make some of the products optional. |
|
121 |
Choose from group lacking products. |
Edit the group settings or add products. |
|
122 |
Choose from group with too many products. |
Edit the group settings or change the mandatory product inclusion settings. |
|
127 |
Same shelf group lacks shelf. |
Edit group settings or change the mandatory product elevation settings. |
|
128 |
Same shelf group is too wide. |
Edit the group settings or change the mandatory product elevation or inclusion settings. |
|
129 |
Same shelf group is too tall. |
Edit the group settings or change the mandatory product elevation or inclusion settings. |
|
132 |
Match facing group without match. |
Edit the group settings or change the mandatory product inclusion settings. |
Once all errors are corrected, you can submit the optimization run.
The Assortment Mapping tab is used to view and edit the results of the automated mapping between assortments and planograms that the system performs.
The Assortment Mapping interface is divided into two sections. The Select Assortment table lists all assortments with a status of either Ready for SO or POG Mapping Needs Review. When you first access this screen, it is pre-filtered to show only POG Mapping Needs Review assortments, with the QBE field for the Status column already filled in. To see the Ready for SO assortments, you must clear this field and click Enter to trigger the update.
The Assortment to Planogram Mapping table displays the planogram mappings for each combination of location and product in a given assortment. You must have the appropriate permissions to edit the assortments.
Use the Save Button to save and validate any edits you make. This updates the mappings and refreshes the mapping table display. You must save your changes for one assortment before editing another assortment.
The Select Assortment table, shown in Figure 6-68, displays a list of the assortments that require mapping. These assortments have a status of either Ready for SO or POG Mapping Needs Review. Use this list to select an assortment to edit.
When you select an assortment to edit and click the Edit button, you see the Edit Status dialog box. You can toggle the status of the assortment between Ready for SO and POG Mapping Needs Review by using the radio buttons. These radio buttons are disabled if errors exist in the assortment mapping table.
Table 6-43 Select Assortment
| Field | Description |
|---|---|
|
ID |
The ID of the assortment. |
|
Name |
The name of the assortment. |
|
Last Updated By |
The user ID of the person who last updated the assortment. |
|
Last Update |
The date when the assortment was last updated. |
|
Location Level |
The location level for the assortment (Store Cluster or Cluster Assortment). |
|
Product Category |
The product category for the assortment. |
|
Status |
The status of the assortment. |
Once you select an assortment from the Select Assortment table, you see the components of that assortment (Figure 6-69). You can add a planogram mapping, delete a mapping, change the planogram node for the mapping (re-mapping), or edit the demand spread factor for the mapping.
Figure 6-69 Assortment to Planogram Mapping
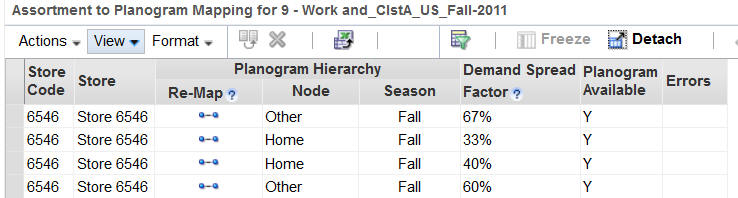
Adding Planogram
Use the Add Planogram button to add a planogram mapping row that is similar to the mapping row you select. This action copies all the data from the original row with the exception of Node, Season, Demand Spread Factor, Store Count, Stores with Planograms, and Errors. You are presented with a dialog box in which you specify the planogram node. If you cancel out of the dialog box without selecting a node, the row you are adding is removed.
Deleting
Use the Delete button to delete a mapping. If you try to delete the only mapping for a specific combination of location and product, you will see an error message.
Re-Mapping
Use the Re-map button to change the planogram node (displayed in the Node column) for the mapping. You see the Select Planogram Node dialog box. When you change this value, three other changes occur. The value for the planogram season (displayed in the Season column) is changed to the first available season for the node. The value for the demand spread factor is changed to 100 percent. The values for Store Count and Stores with Planograms are both changed to zero.
You cannot select a node that results in a duplicate mapping for a specific combination of location and product when the duplicate mapping is defined as a mapping that has the same location, product, and planogram node (regardless of planogram season).
Editing the Demand Spread Factor
You can edit the demand spread factor within the Assortment to Planogram Mapping table. You must enter a number between 1% and 100%. For a set of mappings for the same combination of location and product, the total of the demand spread factors for the mappings cannot be greater than 100 percent. If the number exceeds this, you will see an error message after you click Save (which validates your edits).
The Assortment to Planogram Mapping tables for Stores and for Clusters are slightly different. The following two tables describe each table.
Table 6-44 Assortment to Planogram Mapping for Stores
| Field | Description |
|---|---|
|
Store Code |
The store code. |
|
Store |
The name of the store. |
|
Assortment Cluster |
The name of the assortment cluster. |
|
Product Code |
The product code. |
|
Product Name |
The name of the product. |
|
Planogram Hierarchy - Re-map |
The button you use to select a new planogram node for the mapping. |
|
Planogram Hierarchy - Node |
The planogram node, which is the sub-category level of the assortment product hierarchy that the mapping applies to. |
|
Planogram Hierarchy - Season |
The season that the mapping applies to. |
|
Demand Spread Factor |
The amount of demand that should be allocated to the mapping (within a specific combination of location, product, node, and season. |
|
Planogram Available |
Y = planogram is available for a specific combination of location, product, planogram node, and planogram season. N = not available. |
|
Errors |
The errors that occur during mapping. |
Table 6-45 Assortment to Planogram Mapping for Clusters
| Field | Description |
|---|---|
|
Assortment Cluster |
The name of the assortment cluster. |
|
Product Name |
The name of the product. |
|
Demand Spread Factor |
The amount of demand that should be allocated to the mapping (within a specific combination of location, product, node, and season. |
|
Planogram Hierarchy - Re-map |
The button you use to select a new planogram node for the mapping. |
|
Planogram Hierarchy - Node |
The planogram node, which is the sub-category level of the assortment product hierarchy that the mapping applies to. |
|
Planogram Hierarchy - Season |
The season the mapping applies to. |
|
Store Count |
The number of stores in the assortment cluster. This value is zero for mappings that are edited. |
|
Stores With Planograms |
The number of stores in the assortment cluster that have planograms for the selected planogram set, based on the planogram data that has been loaded. This value is zero for mappings that are edited. |
|
Errors |
The errors that occur during mapping. |
|
Product Code |
The product code. |
Three errors are identified by the mapping process.
Total demand spread factor (DSF) out of range. Action: The value must not exceed a 100 percent the DSF within the mapping. Results must be adjusted to stay between 1% and 100%.
Unmapped product. Action: There is no mapping information for a product. Add the mapping information and manually map the product or remove the product from the assortment feed.
Unmapped store. Action: There is no POG available for the store. Add store information to the POG feed, remove the store from the assortment, or update the mapping information to map the assortment against a different POG Set with information for the store.
|
Note: After providing new data (with the exception of the assortment files), such as POGs, mapping data, and so on, that specifically provides a solution for the exceptions and errors found by the mapping process, the user must execute the Re-map action from the pull-down menu. This will trigger a new mapping process run for the assortment against the latest data available. The new data picked by the remapping process can clear the exceptions and errors found by the last mapping process and allow the assortment to move forward for optimization. |