To access the EVA sheet:
- Go to the Earned Value Analysis log window.
- Click to select your sheet.
- Click the gear menu (
 ) to open and select Open. The Earned Value Analysis sheet opens in new window. Alternatively, you can double-click on the sheet to open the sheet window.
The upper section of the EVA sheet is fixed and viewed across all tabs. It includes the toolbar functions and a dynamic data table. The following explains the elements.
Filter | To adjust the view for particular information. |
|---|---|
Print | To print the sheet. |
Data Date | This field has a drop-down menu with historical dates. This is available for graph based on Data Date. |
Projects | This field enables you to open the Project Picker window and select a project. The information is constrained with value in Data Date field. The Project Picker window enables you to Find on Page. |
Period | The drop-down list with weekly, monthly, quarterly, half a year, yearly, and if applicable, financial period that has been selected in the shell. This is available for graph based on Period. |
WBS or CBS drop-down | This toggle option is followed by the corresponding picker in the adjacent field (WBS Code or CBS Code drop-down). The picker user interface has Expand, Collapse, and Find on Page. the values are constrained by selections in the previous fields. Select the WBS graph and click WBS picker to filter by the OBS. The WBS picker will also display the WBS codes from the Unifier project, if the Unifier project is selected from the Projects Picker. |
WBS Code or CBS Code drop-down | Click to open and select from WBS Picker or CBS Picker windows, respectively. |
Cost & Rate Type | Displays all rate- and cost-type breakdowns available. It enables you to select a rate-type or a cost-type grouping. Once you select the breakdown rows to filter, then all of the costs will be displayed based on breakdowns that you had selected. |
Apply | Click to apply selections in the drop-down fields. |
Reset | Click this to remove any zoom or filters applied via the curve picker. |
The middle section of the EVA sheet contains a Dynamic Data Table.
The headings for the dynamic data table are as follows, depending on the graph type:
- Project
- All is displayed when all projects have the same data date.
- All (Filtered) is displayed when there are projects with differing data dates, and projects with the selected data date are filtered in the view.
- WBS
Displays the calculated values for the point plotted in the graph.
- Cost & Rate Type
Displays the cost and rate types in the graph.
The other headings may include:
- Date
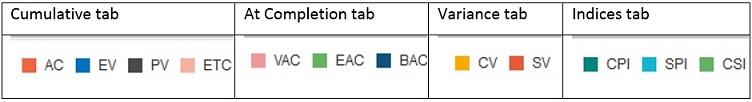
- Related EV metrics labels based on the tab. For example, in the Cumulative tab, the columns show PV, EV, AC, ETC, RC, CPI, and SPI.
The middle section of the EVA sheet contains the following tabs:
- Cumulative
- Incremental (only applicable to period based graph.)
- At Completion
- Variance
- Indices
Depending on the tab that you select, you get the pertinent graph.
Curve Picker: Filter curves you want to view by selecting or clearing the colored boxes in the legend.
Unit Based
Earned Value Analysis - Graph
All of the Planned Units and Actual Units will be rolled-up for Project, WBS, and CBS from the Activity Sheet. The EV value will be calculated using the following formula:
EV Units = BAC Units* PPC
Earned Value Analysis - Grid
For the Graph Type Unit based, the Grid will display units instead of costs (Planned units, Actuals Units, and so forth). The Variances, Indices, and At Completion values will also be updated based on the values.
Earned Value Analysis - Top bar
For the Graph Type Unit based, the bar will display units instead of costs (Planned units, Actuals Units, and so forth). he Variances, Indices, and At Completion values will also be updated based on the values.
Remaining Cost > Remaining Cost/Units
Cost Sheet
After you create multiple EVA graphs, the cost sheet drop-down menu displays all the cost-based graphs.
Roll up Actuals to EVA
The Amount and the uuu_quantity fields are going to rollup to the WBS Sheet. They will be used to feed into the Actuals in the EVM sheet. Unlike the existing column in the Cost Sheet that creates a new row in the EVM sheet, the new BP will rollup to the WBS and CBS for a P6 project. Since Unifier captures units in the EVM, you can add uuu_quantity and have the units roll up to the EVM sheet.
Cost Based EVA Scenario
In the EVA Sheet, The Actuals amount will be rolled up by associated WBS when you select a new Cost-type BP (CBS or WBS) column as the Cost Sheet column source. You can see the Actuals associated with the selected WBS codes by using filtering.
When you filter by WBS codes in the EVA, the Actuals data will be in two separate rows (both Unifier and P6 Actuals).
By default, in the Project view, all the Actuals (including the actuals from cost sheet column source) are displayed.
The Actuals amount will be rolled up by associated CBS when filtered by CBS codes, in Cost-based EVA scenario. When selected filter by CBS or by P6 Projects, you can see the Actuals for Unifier and P6 for the filtered CBS codes, separately.
Filtering by CBS codes in EVA Sheet
The Rolled up Actual cost will be displayed in the EVA Sheet for the selected CBS codes only when there is a valid CBS-WBS combination allocated for the line item. That is to state, the Rolled up Actual cost will be displayed in the EVA Sheet for selecting any CBS assigned to receptive Activity and selecting WBS code from the same p6 project.
Filtering by WBS codes in EVA Sheet
The Rolled up Actual cost will be displayed in the EVA Sheet for the selected WBS codes even when there is an invalid CBS-WBS combination allocated for the line item. That is to state, the Rolled up Actual cost will be displayed in the EVA Sheet for selecting any CBS assigned to receptive Activity and selecting WBS code from the the same, or different, p6 project.
Units Based EVA Scenario
The WBS Sheet column field is available in unit based EVA scenario as the Actual source. The list of sources available are all WBS Sheet columns which are of type SYS BP Decimal Amount. You can select any of the new CBS- or WBS-type BP columns (which are of SYS BP Decimal Amount added in WBS Sheet as WBS Sheet column source).
The Formula columns which are based on CBS- or WBS-type BP of SYS BP Decimal Amount should are available to select.
By default, the Actual Units (per project) include the quantity (rolled up from new Cost-type BP) when the Actual Units are selected as WBS Sheet column source.
The Actual Units (uuu_quantity) by associated WBS codes are displayed when you filter the WBS codes.
Similarly, when CBS codes are filtered, the associated Actual Units are displayed. The same is applicable when other Cost-type BPs are also selected as the Cost Sheet column source. The graph includes the Actual Units from WBS Sheet column source.