You must have at least one cash flow summary curve defined in order to see Summary Curves listed on the Summary Curves tab.
You can create cash flow summary curves in the project Cash Flow log or by using Manage Summary Curves.
The following topics are explained in this section:
- About Summary Curves
- Summary Curve Cash Flow WorkSheet
- Filter for Summary Curves
- Filter for Detail Curve
- Showing Detailed CBS Codes in Summary Curves and Curve Combinations
- Creating Cash Flow Summary Curves
- Opening an existing Summary Curves Cash Flow Window
About Summary Curves
Each Project/Shell cash flow has a system defined Project/Shell Summary Curve. The Summary menu item displays the system defined Project/Shell summary curves with a separator lines between Manage Summary Curves and each Project/Shell Summary Curve. This feature applies to existing Detail Curves as well as all new curves that a user created.
A user can access the list of available individual Project/Shell Summary Curve by clicking the Summary drop-down list (the down arrow).
Notes:
- Similar to users with permission to access Custom Summary Curves, users with access to Cash Flow module have access to each Project/Shell Summary Curve, automatically.
- The Manage Summary Curves menu item is not available to users who do not have Edit permission for cash flows.
- If users do not have Edit permission and no Custom Curves are created, the Summary menu option shows system defined Project/Shell Summary Curve, only.
Summary Curve Cash Flow WorkSheet
The Summary Curve WorkSheet, automatically, includes all Cash Flow records for the Project/Shell when a user accesses the Project/Shell Summary Curve.
When the Summary Curve WorkSheet is open, Unifier uses the current Summary Curves default settings:
- All Curves Types are selected
- No Saved Filter options are enabled by default (based on new Filter functionality).
- Entire Date range of all Curves are available in the Timeline (Graph, Timeline, and Table)
- Information is rolled up if Roll Up Status is set to Active on a record
Once the system defined Project/Shell Summary Curve is open, the same functionality for a Summary Curve is available to the user, which includes the enhanced Filter functionality as described in the following sections.
Filter for Summary Curves
When viewing Cash Flow WorkSheet Filter for Summary Curves, the Filter option provides additional filtering options. The following settings are available when filtering for Summary Curves:
- Date Range
- CBS Code Filter
- Save and Manage Filters
- Apply Filter settings to entire Worksheet (includes the Graph, Timeline, and Table)
The Filter menu option of the Summary Curves enables you to open the Filter window and select the Curve Types, set the Timescale, add and determine the Detail Level for both the Graph and the Table sections. The Filter window also enables you to save the filter through the Save As field. The saved filters are available in a global collection and can be accessed by users.
The Cash Flow WorkSheet Filter for Summary Curves is accessible through Project/Shell, only.
When a Summary Curve Cash Flow WorkSheet is open, you can access the Filter menu options through:
- Filter icon
- View > Filter
- Edit > Manage Filters
The Filter icon and the View > Filter options are available for both Detail Curve and Summary Curves. These options are not available (disabled) if the Cash Flow WorkSheet does not contain any Curve Types.
Note: At least one curve type must be selected.
The Saved Filter dropdown field enables you to access previously saved filters.
To reload records after updates, do the following:
- Close Summary Curve Cash Flow WorkSheet
- Open Summary Curve Cash Flow WorkSheet
- Click Reset and switch to a different saved filter or a blank filter.
On the Summary Curve Table section, the following options are available:
- Zoom: To set the zoom level for the Graph
- Reset: To reset the zoom level and all applied filters (enable all curve types)
- Y (icon): To view the Summary Curve by year (Y)
- Print: To print the Summary Curve.
The Filter menu option of the Summary Curves enables you to open the Filter window and select the Curve Types, set the Timescale, and determine the Detail Level.
Curve Types
This section lists all the curve types that are available for the Summary Curve WorkSheet.
Selecting a curve from the Curve Types box in the Filter window enables you to filter both the Graph and the Table.
The Filter menu option for Summary Curve is accessible through Project/Shell, only.
When opening a previously saved filter, only previously saved Curve Types appear and checked. If a curve type is disabled (not available in the current Summary Curve), the curve type remains checked but disabled. Users cannot uncheck a disabled Curve Type. If a curve type is disabled, the current Summary Curve WorkSheet does not have that particular curve type as a data source.
For Summary Curves, all curve types are selected and enabled. Curve types can be deselected or selected individually. Only the curve types that are available in summary curve are shown in the filter window.
Note: At least one curve type must be selected.
Timescale
The From Date and To Date fields are read only. Users can enable the dates through date picker.
Once a date is selected the proper date format appears in the field, based on user date format preferences.
The Summary Curve date range consists of the available date range based on included Curve data. When a user adds a Timescale or timeline to a Filter, then the Timescale or timeline for the Curve Graph and Table begins and ends with the From Date and To Date in the filter.
Users can also adjust the Timescale or timeline using the sliders (left or right) within the Graph.
The default value for Timescale is the entire unfiltered timeline.
The following conditions apply to The Summary Curve date range:
- Users cannot move forward or backward in time beyond the filter Timeline definition.
- If the Timescale or timeline is not defined, then the timeline cannot be moved forward or backward beyond the available curve schedule.
- When the Timescale or timeline filter is applied, both the Graph and Table reflect the new timeline and Graph and Table columns only displays the date range that has been configured in the Filter.
From Date
The date for the From Date must be equal to or earlier than the date for the To Date. If this condition is not present, Unifier displays an alert and reverts the value to a date selected during the previous entry, or displays a blank field.
If the Cash Flow Timescale supports Month increments, then the selected Month in the From Date is the starting Month.
If the Cash Flow Timescale supports Year increments, then the selected Year in the From Date is the starting Year.
Note: The selected Day is never used.
If users do not enter a date in the From Date field, then the worksheet starts the date based on the curve date.
If users enter a date earlier than the curve date, then Unifier updates this error and starts the From Date based the curve date.
To Date
The date for the To Date must be equal to or later than the date for the From Date. If this condition is not present, Unifier displays an alert and reverts the incorrect date to a date selected during the previous entry, or displays a blank field.
If the Cash Flow Timescale supports Month increments, then the selected Month in the To Date is the ending Month.
If the Cash Flow Timescale supports Year increments, then the selected Year in the To Date is the ending Year.
Note: The selected Day is never used.
If users do not enter a date in the To Date field, then the worksheet starts the date based on the curve date.
If users enter a date later than the curve date, then Unifier updates this error and ends the To Date based the curve date.
Detail Level
There are two options available: Summary CBS and CBS. When applicable, the CBS option is selected as default. You can only select one option.
Your project Cost Sheet determines which of the two options are enabled in this window.
Note: Since the Cost Sheet at the Company and Program levels does not display CBS information:
- If the cost sheet structure is Flat, then only CBS option is enabled.
- If the Summary CBS and CBS are both enabled, then the condition is Tree.
- If values have been added to the list of CBS codes in the Detail Level section, switching from one option to another will remove the existing values automatically.
- If one of the options is checked and disabled, you cannot select that option.
The Add button in the Detail Level section enables users to:
- Filter worksheet data by adding information related to Summary CBS or CBS.
- Open an existing Summary CBS or CBS code picker window and to the Detail Level list. You can open and add more than one saved curve.
Note: The Program and Company level Filter window contains the "Curve Types" section (similar to the Detail Curve), but the Program and Company level Filter window does not have the Timescale, Detail Level, and Save" options.
Users can only add Summary CBS or CBS codes that are available on the Project Cost Sheet. Also:
- At least one value must be added the list to enable Detail Level filtering.
- Curves that may be filtered by the appropriate Detail Level can be filtered, only. See the following "Showing Detailed CBS Codes in Summary Curves and Curve Combinations" section for a list of possible combination of curves that support Summary CBS or CBS curves.
- Values that match the Filter criteria appear in the worksheet (Graph and Table), only.
- Only Summary CBS or CBS codes that are included in the Detail Level filter appear in Curve Type detail window.
The Remove button in the Detail Level section enables users to remove an existing Summary CBS or CBS code that was added.
Note: The Program and Company level Filter window contains the "Curve Types" section (similar to the Detail Curve), but the Program and Company level Filter window does not have the Timescale, Detail Level, and Save" options.
Save As
The Filter window enables users to save the filter through the Save As field. The saved filters are available in a global collection and can be accessed by users at anytime.
Notes:
- The Save button remains disabled until you enter a name.
- If a name has already been used for a filter, using the same name for a new filter generates an alert notifying the user that the name already exists. You cannot override an existing Filter unless you modify the existing Filter, without changing the name.
- Click OK or Save to apply the filter and close the window. Saved filters appear in the Filter drop-down list.
To manage and access saved filters click Edit from the menu and select Manage Filters. The Manage Filters window opens and enables you to:
- Open or remove saved filters.
- Change name and description of a filter.
OK and Cancel
- OK: Use this option to confirm changes.
- Cancel: Use this option to cancel changes in the form and exit the Filter window.
Filter for Detail Curve
The Detail Curve Cash Flow WorSheet contains the Graph and the Table sections.
On the Detail Curve Table section, the following options are available:
- Zoom: To set the zoom level for the Graph
- Reset: To reset the zoom level and all applied filters (enable all curve types)
- Y (icon): To view the Summary Curve by year (Y).
- Print: To print the Summary Curve.
When a Detail Curve Cash Flow WorkSheet is open, users can access the Filter menu options through:
- Filter icon
- View > Filter
- Edit > Manage Filters
The Filter icon and the View > Filter options are available for both Detail Curve and Summary Curves. These options are not available (disabled) if the Cash Flow WorkSheet does not contain any Curve Types.
The Filter menu option of the Detail Curves enables users to open the Filter window and select the Curve Types, set the Timescale, and determine the Detail Level. The saved filters are available in a global collection (within the project) and can be accessed by users.
Curve Types
This section lists all the curve types that are available for the Detail Curve WorkSheet.
Selecting a curve from the Curve Types box in the Filter window enables users to filter both the Graph and the Table.
The Filter menu option for Detail Curve is accessible through Project/Shell, Company, and Program.
For Detail Curves, all curve types are selected and enabled. Curve types can be deselected or selected individually.
Note: At least one curve type must be selected.
OK and Cancel
- OK: Use this option to confirm changes.
- Cancel: Use this option to cancel changes in the form and exit the Filter window.
Showing Detailed CBS Codes in Summary Curves and Curve Combinations
For Summary curves with all child curves at the CBS detail level, when creating a summary cash flow curve, if CBS details are available for all of the curves, summarized data is displayed at individual CBS levels in the details. However, if there is a curve in the selection that does not have CBS level details (for example, Project/Shell or Commitment levels), then summary details will display individual curve names.
Data will always be in project currency. If child curves have the same transaction currency, then you have the option to show data in transaction currency, as well.
Curve Combinations
This section describes what Detail level is shown when multiple Curves are summarized. The Detail level displays in Summary CBS or CBS when multiple Cash Flow Curves are of matching type. For Commitment Detail Type curves, the Detail type is defined at the individual curve level.
|
| All Data Source | Commitment Cash Flow Granularity per Data Source | ||||
|---|---|---|---|---|---|---|---|
| Curves On | Project/Shell | Summary CBS | CBS | Single Distribution | Individual Records | By Line Items of SOV |
All Data Source | Project/Shell | One Line per Detail Curve | One Line per Detail Curve | One Line per Detail Curve | One Line per Detail Curve | One Line per Detail Curve | One Line per Detail Curve |
Summary CBS | One Line per Detail Curve | By Summary CBS | One Line per Detail Curve | One Line per Detail Curve | One Line per Detail Curve | One Line per Detail Curve | |
CBS | One Line per Detail Curve | One Line per Detail Curve | By CBS | One Line per Detail Curve | One Line per Detail Curve | By CBS | |
Commitment Cash Flow Granularity per Data Source | Single Distribution | One Line per Detail Curve | One Line per Detail Curve | One Line per Detail Curve | One Line per Detail Curve | One Line per Detail Curve | One Line per Detail Curve |
Individual Records | One Line per Detail Curve | One Line per Detail Curve | One Line per Detail Curve | One Line per Detail Curve | One Line per Detail Curve | One Line per Detail Curve | |
By Line Items of SOV | One Line per Detail Curve | One Line per Detail Curve | By CBS | One Line per Detail Curve | One Line per Detail Curve | One Line per Detail Curve | |
Creating Cash Flow Summary Curves
You have two options for creating a Summary Curve:
- Option one: Creating a Summary Curve using the Cash Flow log
- Option two: Creating a Summary Curve using the Manage Summary Curves
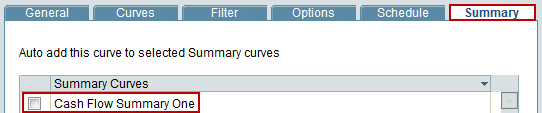
Note: By default, summary curves in the Summary tab are displayed in bold, checked, and cannot be unchecked.
Option one: Creating a Summary Curve using the Cash Flow log
- Open the project for which you want to create a Summary Curve.
- Click Cost Manager > Cash Flow to open the Cash Flow log window.
- From the Cash Flow log window select the cash flow curves that you want to include in the Summary Curve.
- Click Summary to open the Cash Flow WorkSheet window and see both the Graph and Table views. The View option in the Table pane enables you to toggle between incremental and cumulative Table views.
Incremental curve: An incremental curve displays the cash flow for a certain period.
Cumulative curve: A Cumulative curve displays the net of all cash flows over a period of time.
Option two: Creating a Summary Curve using the Manage Summary Curves
You can create cash flow summary curves in the project Cash Flow log using Manage Summary Curves (see Manage Summary Curves).
- Open the project for which you want to create a Summary Curve.
- Click Cost Manager > Cash Flow to open the Cash Flow log window.
- Click the Summary drop-down list (the down arrow) and select Manage Summary Curve to open the Manage Summary Curves window.
- Form the Detail Curves pane, select as many detail curves as you need and click New to open the Manage Summary Curves pane.
- Enter a name for your new Summary Curve in the field and click Add. The Detail Curves window opens.
- From the Detail Curves window, click to select the cash flow curves that you want to include in the Summary Curve, and click Select.
- In Manage Summary Curves window, click Save and close the window.
The cash flow summary curves display in the Summary Curves tab.
There are no additional permissions for summary curves; if you can see a cash flow curve, you can add it to a Summary Curve.
After you save a Summary Curve, the users with View permission can see your summary curve.
Opening an existing Summary Curves Cash Flow Window
To open an existing Summary Curves Cash Flow window:
- Open the project or shell where the summary curve exists.
- Click Cost Manager > Cash Flow. The Cash Flow log opens.
- On the Cash Flow log toolbar, click the Summary button drop-down arrow, and select any previously created summary curves listed below Manage Summary Curves.
- Clicking a listed summary curve opens the Cash Flow WorkSheet for that summary.
- In the Cash Flow WorkSheet, in the Curves detail window you can open a data source to see its source cash flows.
- Data in this mode is read-only; however, you can edit the data in the source cash flow Details window.
- Click the Close Window button when ready.