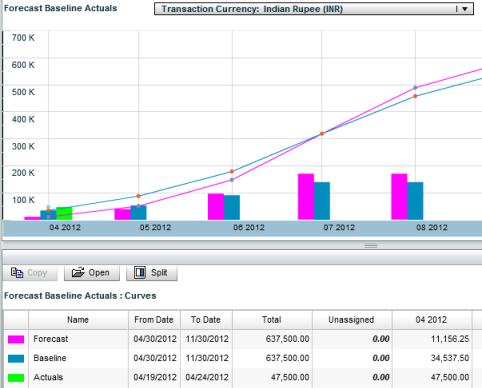
A Summary Cash Flow Curve displays selected cash flows from your project. For example, you can collect and view:
- Forecast data across all commitment curves in a project.
- Data from contracts and schedule sheets.
- Baseline, Forecast, Actuals (or "spends"), and Derived information from contracts and commitments.
In Summary curves, Unifier aggregates cost data according to Cash Flow Data Sources (set in the Cashflow Datasources window).
Example
- Baseline
- Forecast
- Actuals (or "spends")
- Portfolio Budget
- Derived
See Cash Flow Properties Settings: Curves tab (Classic View) for more information.
Unifier displays summarized cost data in a Cash Flow WorkSheet. The main window charts summary data, and the curves window lists each cost data source. You can open a data source and see the source cash flow curves.
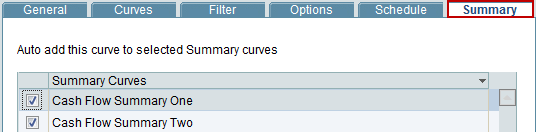
Once you define at least one Summary Curve in your project, Unifier lists the Summary curve as a selection on the curve properties Summary tab.
Showing Detailed CBS Codes in Summary Curves
For Summary curves with all child curves at the CBS detail level, when creating a summary cash flow curve, if CBS details are available for all of the curves, summarized data is displayed at individual CBS levels in the details.
However, if there is a curve in the selection that does not have CBS level details (for example, Project/Shell or Commitment levels), then summary details will display individual curve names.
Data will always be in project currency. If child curves have the same transaction currency, then you have the option to show data in transaction currency, as well.