Purpose
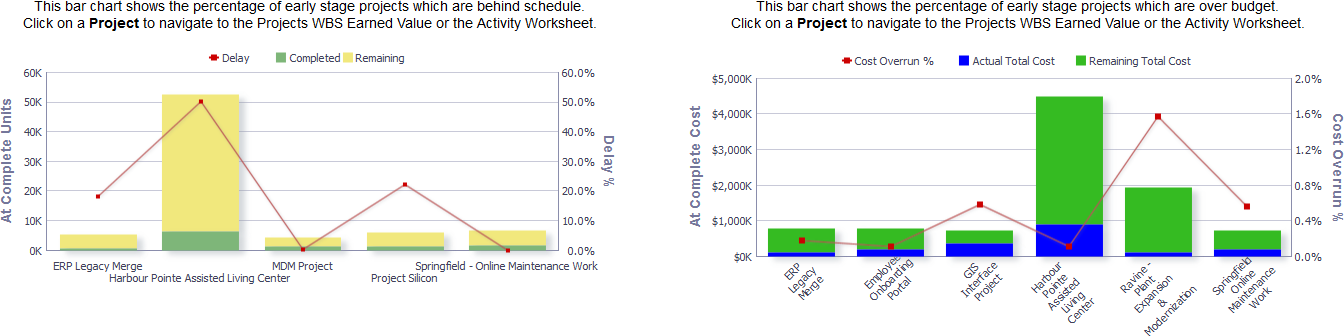
The stacked line-bar chart on the left displays the early stage projects that are behind schedule. The x-axis shows project names. The y-axis for the bars (left) shows At Complete Units. The y-axis for the line (right) shows Delay percentage.
The stacked line-bar chart on the right displays the projects that are overbudget. The x-axis shows project names. The y-axis for the bars (left) shows At Complete Cost. The y-axis for the line (right) shows Cost Overrun percentage.
Location
- On the Home page, click Dashboards.
- Under Primavera, select Main.
- On the Main dashboard, click the Overview page.
- On the Overview page, expand the Early Stage Projects behind Schedule section.
Subject Area
Activity