Purpose
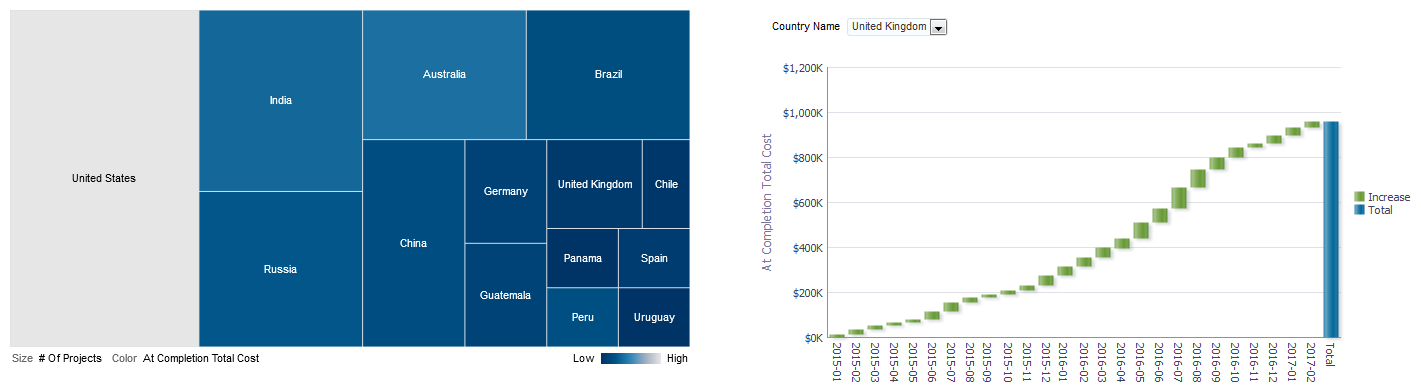
The tree map shows the relative number of projects by country.
The waterfall chart shows At Completion Total Cost amounts for the selected country.
The x-axis shows months. The y-axis shows the amounts.
Location
- On the Home page, click Dashboards.
- Under Primavera, select Main.
- On the Main dashboard, click the Overview page.
- On the Overview page, expand the At Completion Cost Summary section.
Subject Area
Activity