Purpose
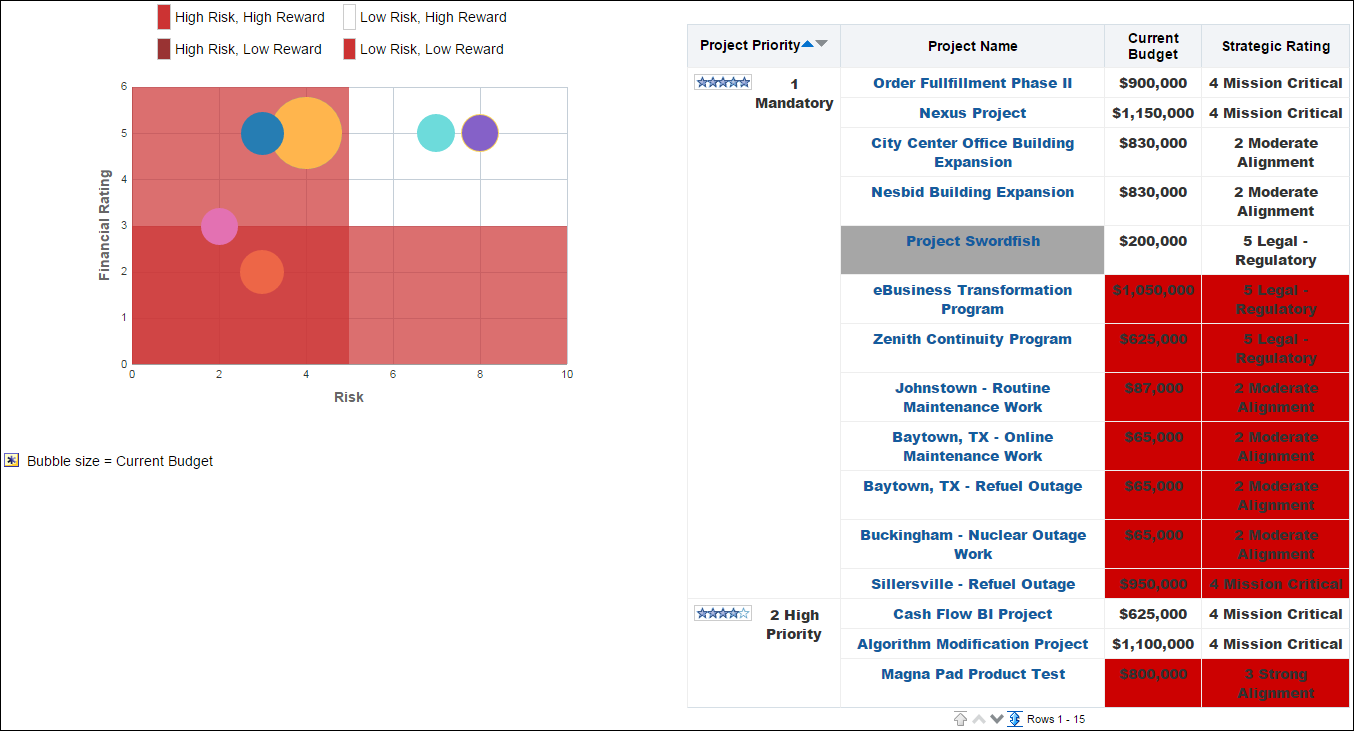
The bubble chart plots projects according to their financial rating and risk. Bubbles in the red quadrant of the bubble chart have a low financial rating (reward) and a high risk; those in the white quadrant have a low risk but offer a high reward. Risk in this case is a project code and is not related to P6 EPPM risks functionality.
The x-axis shows Risk. The y-axis shows Financial Rating. Bubble size represents current budget, with a larger bubble representing a larger value. Bubble color is used only to differentiate between bubbles. Hover over a bubble for specific details.
The pivot table groups projects according to their priority. The pivot table contains columns for:
- Project Priority
- Project Name
- Current Budget
- Strategic Rating
Use the up and down arrows below the table to navigate to other sections of the table. Use the double-ended arrow to view the whole table in one screen (to a maximum of 500 rows per page).
Location
- On the Home page, click Dashboards.
- Under Primavera, select Portfolio Analysis.
- On the Portfolio Analysis dashboard, click the Prioritization page.
- On the Prioritization page, expand the Risk vs. Reward section.
Subject Area
Activity