Purpose
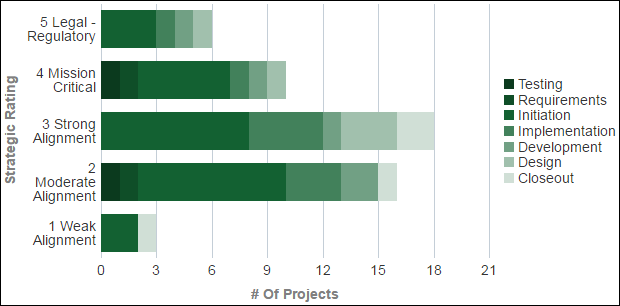
The bar chart shows the number of projects for each strategic rating, grouped by the current phase project code. Each band on a bar represents a different value of the current phase sample project code.
The x-axis shows the number of projects. The y-axis shows Strategic Rating. Hover over a band to see specific information.
Location
- On the Home page, click Dashboards.
- Under Primavera, select Portfolio Analysis.
- On the Portfolio Analysis dashboard, click the Prioritization page.
- On the Prioritization page, expand the Project Initiation section.
Subject Area
Activity