Purpose
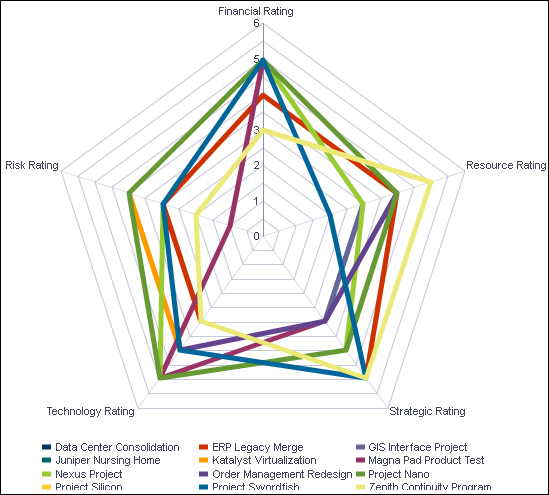
The radar chart shows project code ratings per project.
Each colored line on the chart represents a separate project. The axes show the following project codes:
- Financial Rating
- Resource Rating
- Strategic Rating
- Technology Rating
- Risk Rating
Location
- On the Home page, click Dashboards.
- Under Primavera, select Portfolio Analysis.
- On the Portfolio Analysis dashboard, click the Prioritization page.
- On the Prioritization page, expand the Rating section.
Subject Area
Activity