Purpose
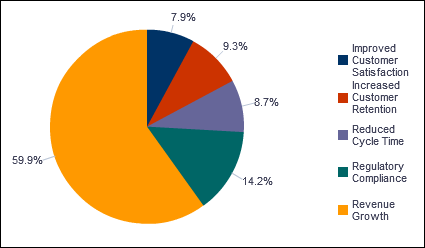
The pie chart shows the investment (determined from At Completion Total Cost for the project) broken down by the Strategic Objective project code. The segments represent the amount of At Completion Total Cost accountable to each Strategic Objective.
The Strategic Objective project codes are:
- Improved Customer Satisfaction
- Increased Customer Retention
- Reduced Cycle Time
- Regulatory Compliance
- Revenue Growth
Location
- On the Home page, click Dashboards.
- Under Primavera, select Portfolio Analysis.
- On the Portfolio Analysis dashboard, click the Objectives page.
- On the Objectives page, expand the Investment by Strategic Objective section.
Subject Area
Activity