Purpose
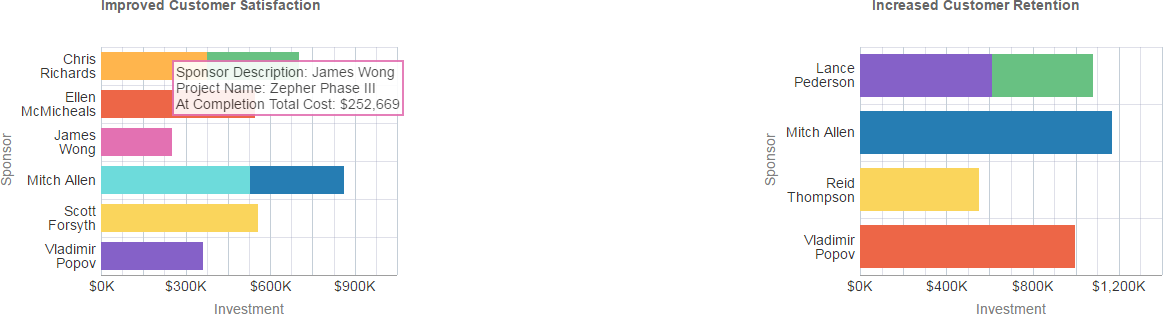
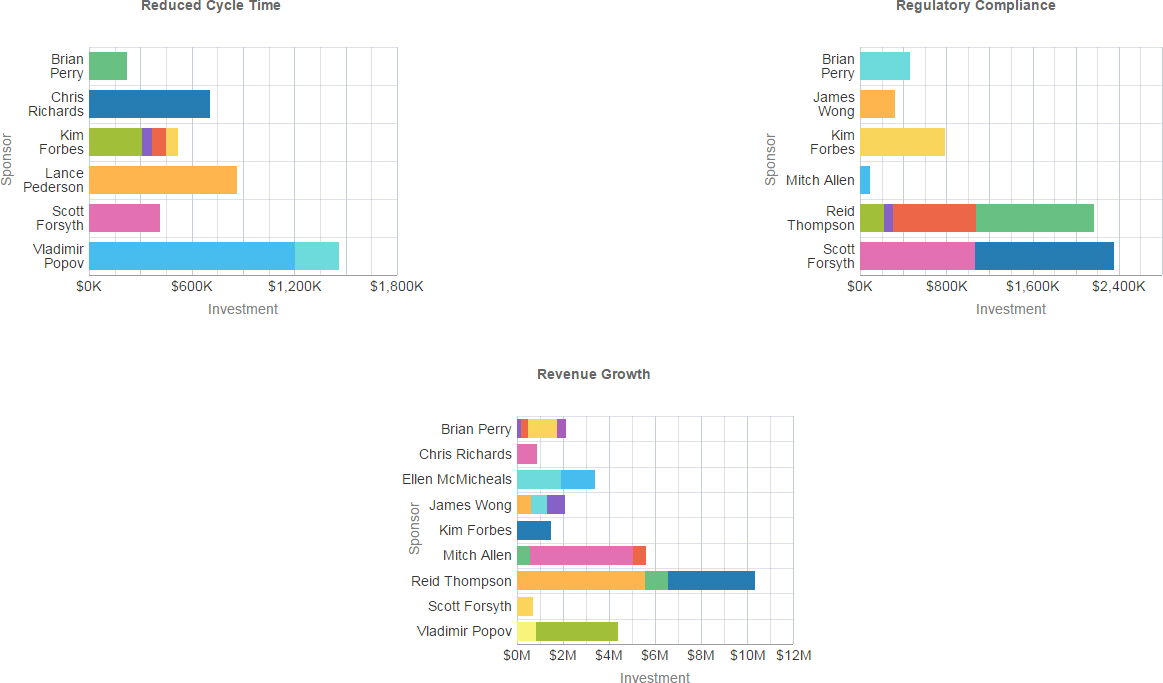
The Improved Customer Satisfaction, Increased Customer Retention, Reduced Cycle Time, Regulatory Compliance, and Revenue Growth stacked bar charts show the investment amount for projects grouped by sponsor name. Each chart shows data for a different set of projects, selected by a project code. Each band on a bar represents a different project. Hover over a section of a bar to see specific data.
The x-axis shows Investment. The y-axis shows Sponsor.
Location
- On the Home page, click Dashboards.
- Under Primavera, select Portfolio Analysis.
- On the Portfolio Analysis dashboard, click the Objectives page.
- On the Objectives page, expand the Project Performance by Strategic Objective section.
Subject Area
Activity