Purpose
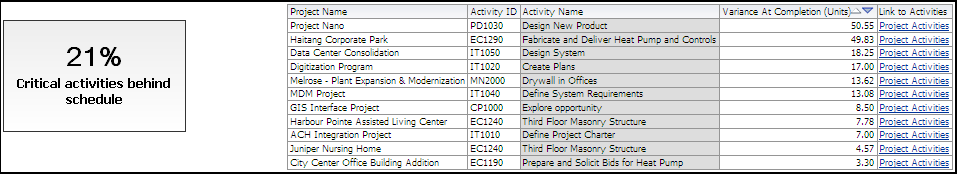
The narrative shows the percentage of critical activities which are behind schedule according to their Baseline Project Finish Date Variance.
The table is grouped by Variance At Completion units, high to low, and then by project. This allows you to see the activities with the highest variance at completion quickly and then to see the other activities which have finish variance in the same project. The table contains columns for:
- Project Name
- Activity ID
- Activity Name
- Variance at Completion (Units)
- A link to the project activities
Location
- On the Home page, click Dashboards.
- Under Primavera, select Project Health.
- On the Project Health dashboard, click the Schedule page.
- On the Schedule page, expand the Critical Activities behind Schedule section.
Subject Area
Activity