Purpose
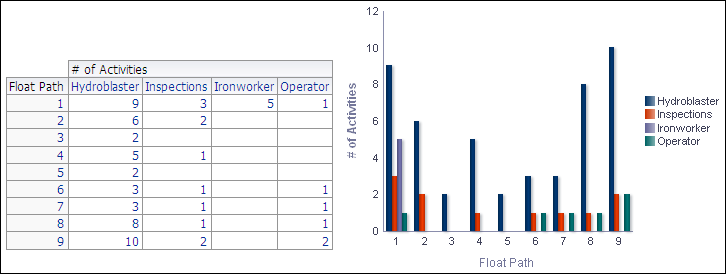
The pivot table shows the number of activities per float path grouped by primary resource.
The bar chart shows the number of activities for each primary resource in a float path.
The x-axis shows the Float Path. The y-axis shows the number of activities. Hover over a bar for specific information.
Location
- On the Home page, click Dashboards.
- Under Primavera, select Project Health.
- On the Project Health dashboard, click the Schedule page.
- On the Schedule page, expand the Float Path section.
Subject Area
Activity