Purpose
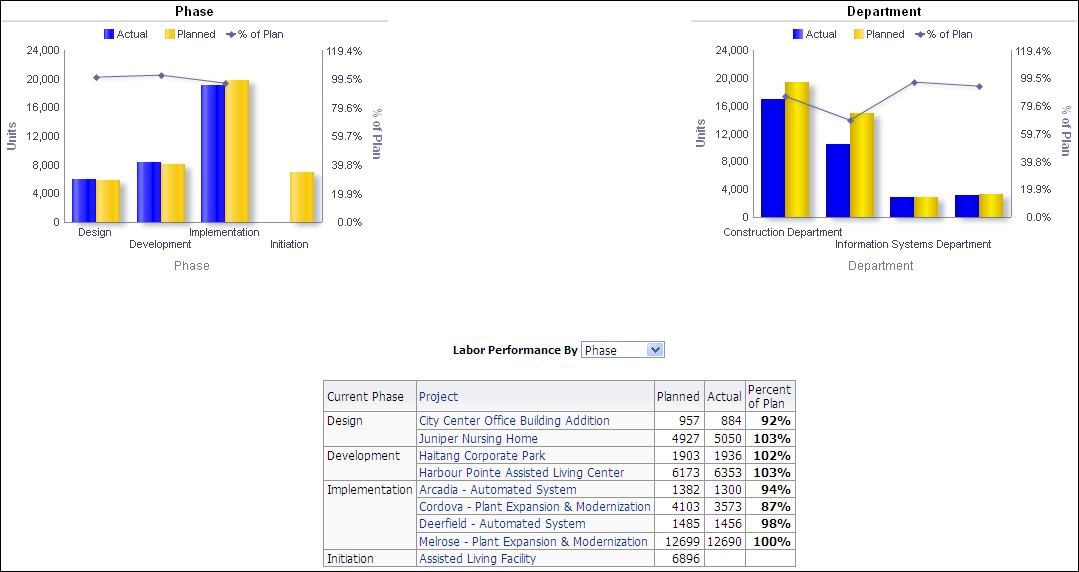
The Phase and Department line-bar charts show data for activities assigned to the Phase and Department activity codes. Both of these line-bar charts show:
- Bars for the Actual and Planned labor
- A line for the Percent of Plan labor units expressed as a percentage of baseline project labor units
The x-axis of the Phase line-bar chart shows Phase code values. The x-axis of the Department line-bar chart shows Department code values. On both line-bar charts the y-axis for the bars, on the left, shows labor Units. On both line-bar charts the y-axis for the line, on the right, shows the Percent of Plan.
Use the Labor Performance By pivot table to determine whether Phase or Department data is displayed. The pivot table contains columns for:
- Current Phase or Department
- Project
- Planned (baseline project labor units)
- Actual (actual labor units)
- Percent of Plan (actual labor units expressed as a percentage of baseline project labor units)
Location
- On the Home page, click Dashboards.
- Under Primavera, select Project Health.
- On the Project Health dashboard, click the Schedule page.
- On the Schedule page, expand the Labor Performance section.
Subject Area
Activity