Purpose
These pivot tables show percent complete data grouped by project name or project ID.
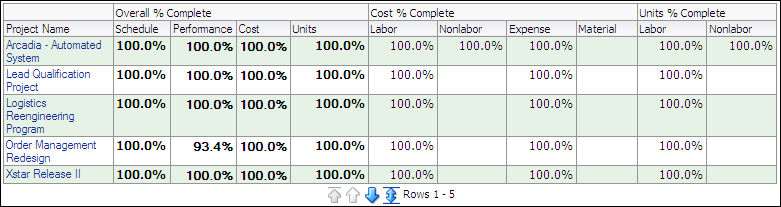
The first pivot table shows percent complete information grouped by project name. The table contains columns for:
- Project Name
- Schedule (Overall % Complete)
- Performance (Overall % Complete)
- Cost (Overall % Complete)
- Units (Overall % Complete)
- Labor (Cost % Complete)
- Nonlabor (Cost % Complete)
- Expense (Cost % Complete)
- Material (Cost % Complete)
- Labor (Units % Complete)
- Nonlabor (Units % Complete)
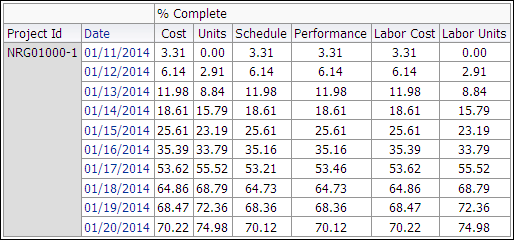
The second table shows percent complete information grouped by project ID and date. The table contains columns for:
- Project ID
- Date
- Cost (% Complete)
- Units (% Complete)
- Schedule (% Complete)
- Performance (% Complete)
- Labor Cost (% Complete)
- Labor Units (% Complete)
Location
- On the Home page, click Dashboards.
- Under Primavera, select Project Health.
- On the Project Health dashboard, click the Schedule page.
- On the Schedule page, expand the Percent Complete Analysis section.
Subject Area
Activity