Purpose
Use the Select a View list to determine how cost and project code information displays. Depending on the selection, the view displays as a bar chart or table. The available views are:
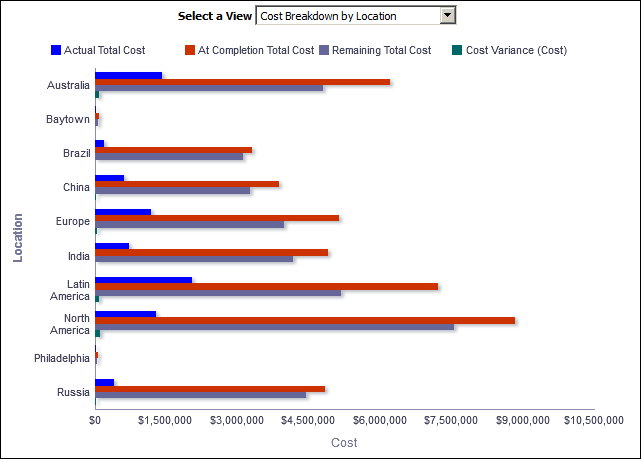
- Cost Breakdown by Location
- Cost Breakdown by Project Manager
- Cost Breakdown by Sponsor
- Table by Location
- Table by Project Manager
- Table by Sponsor
The bar charts break data down by the Location, Project Manager, and Sponsor project codes respectively. The bar charts show bars for:
- Actual Total Cost
- At Completion Total Cost
- Remaining Total Cost
- Cost Variance (Cost)
The x-axis shows Cost. The y-axis shows the project code selected in the Select a View list.
The tables break down data by the Location, Project Manager, and Sponsor project codes respectively. The pivot tables show columns for:
- Project Manager
- Actual Total Cost
- At Completion Total Cost
- Remaining Total Cost
- Cost Variance (Cost)
Location
- On the Home page, click Dashboards.
- Under Primavera, select Project Health.
- On the Project Health dashboard, click the Cost page.
- On the Cost page, expand the Project Cost Breakdown section.
Subject Area
Activity