Purpose
Use the Select a View list to determine whether cost information displays as a bar chart, line chart, or table.
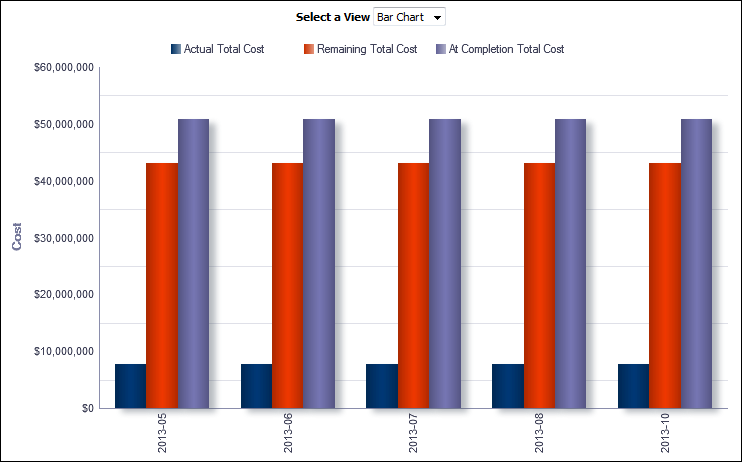
The bar chart shows bars for:
- Actual Total Cost
- Remaining Total Cost
- At Completion Total Cost
The x-axis shows the year and month. The y-axis shows cost. Hover over a bar to see specific information about it.
The line chart shows lines for:
- Actual Total Cost
- Remaining Total Cost
- At Completion Total Cost
The x-axis shows the year and month. The y-axis shows cost. Hover over a point on a line to see specific information about it.
The pivot table breaks data down by project and date. The columns spread the data across five months. The table shows information per project for:
- Actual Total Cost
- Remaining Total Cost
- At Completion Total Cost
Location
- On the Home page, click Dashboards.
- Under Primavera, select Project Health.
- On the Project Health dashboard, click the Cost page.
- On the Cost page, expand the Cost Trend section.
Subject Area
Project History