Purpose
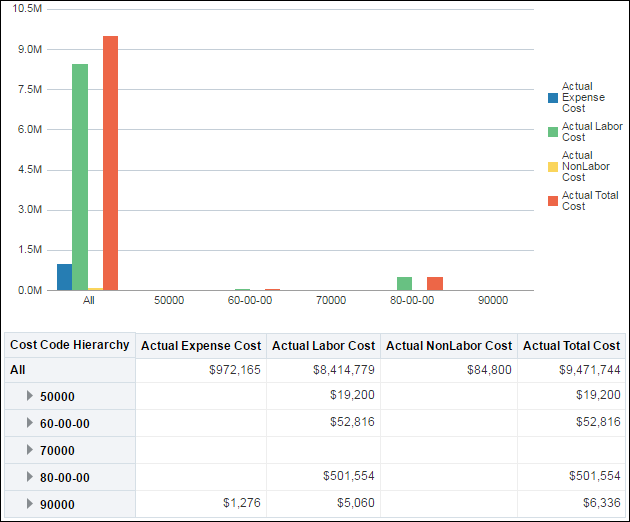
The bar graph displays actual cost details for each cost code. It is broken down by:
- Actual Expense Cost
- Actual Labor Cost
- Actual NonLabor Cost
- Actual Total Cost
The x-axis shows the cost code. The y-axis shows the cost.
You can drill-down each cost code by selecting it on the x-axis or the table.
The table shows the cost code hierarchy broken down by actual expense cost, actual labor cost, actual nonlabor cost, and actual total cost. You can expand each cost code for additional details.
Location
- On the Home page, click Dashboards.
- Under Primavera, select Project Health.
- On the Project Health dashboard, click the Cost page.
- On the Cost page, expand the Cost Code Hierarchy section.
Subject Area
Activity