Purpose
These analyses can be viewed as a bar chart, pie chart, or table.
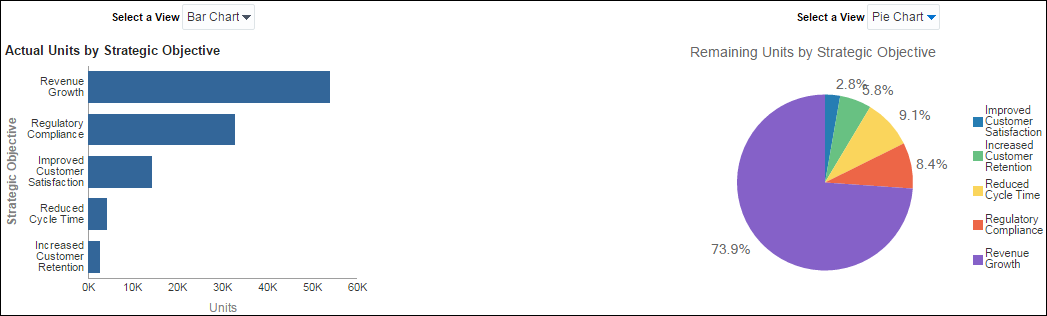
The Actual Units by Strategic Objective and Remaining Units by Strategic Objective bar charts show the number of Actual Units or Remaining Units respectively broken down by Strategic Objective. It shows bars for:
- Increased Customer Retention
- Reduced Cycle Time
- Improved Customer Satisfaction
- Regulatory Compliance
- Revenue Growth
Hover over a bar to see specific data. Click on a bar to drill down to see actual effort by project.
The To Date Units by Strategic Objective and Remaining Units by Strategic Objective pie charts show the number of To Date Units or Remaining Units respectively broken down by Strategic Objective. It shows segments for:
- Improved Customer Satisfaction
- Increased Customer Retention
- Reduced Cycle Time
- Regulatory Compliance
- Revenue Growth
Click on a segment to drill down to see actual effort by project.
The Actual Units and Remaining Units pivot tables show strategic objective and units for each project. The tables show columns for:
- Strategic Objective Description
- Project Name
- Actual Units or Remaining Units
- Year Name (Actual Units table only)
Use the up and down arrows below the table to navigate to other sections of the table. Use the double-ended arrow to view the whole table in one screen (to a maximum of 500 rows per page).
Location
- On the Home page, click Dashboards.
- Under Primavera, select Resource Analysis.
- On the Resource Analysis dashboard, click the Overview page.
- On the Overview page, expand the Resource Alignment section.
Subject Area
Resource Assignment