Purpose
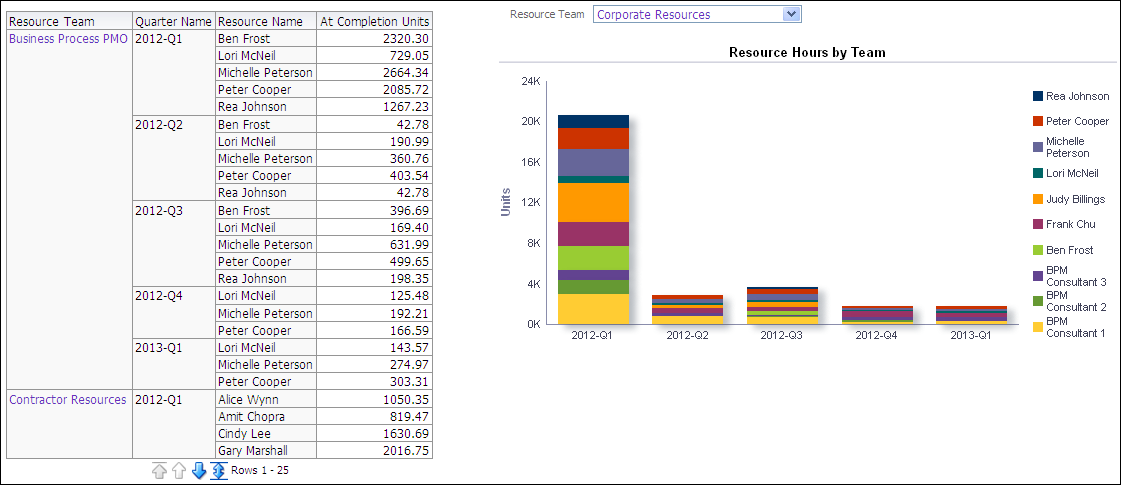
The pivot table shows At Completion Units for each resource in a team broken down by quarter. This data is aggregated by resource team and quarter. Click a resource team name to display that team's data in the stacked bar graph. The table has columns for:
- Resource Team
- Quarter Name
- Resource Name
- At Completion Units
The Resource Hours by Team stacked bar graph shows At Completion Units for each resource per quarter. Use the Resource Team list to filter the data by resource team.
The x-axis shows year and quarter. The y-axis shows At Completion Units. Hover over a bar for details.
Location
- On the Home page, click Dashboards.
- Under Primavera, select Resource Analysis.
- On the Resource Analysis dashboard, click the Staffing page.
- On the Staffing page, expand the Total Hours by Team section.
Subject Area
Resource Assignment