Purpose
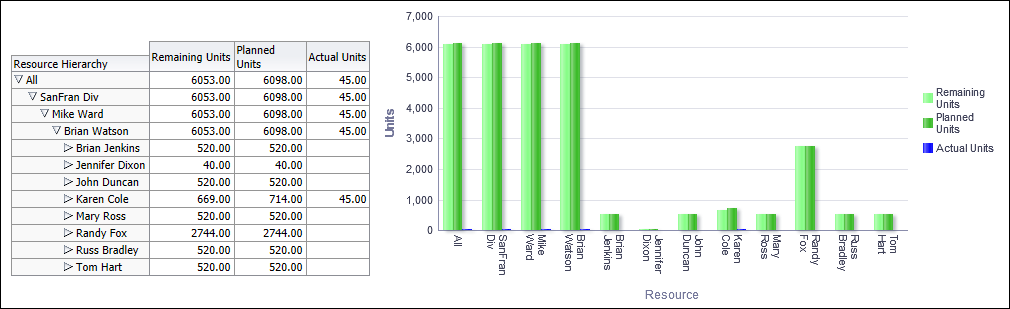
The Resource pivot table and bar chart show units broken down by resource. Both the table and the bar chart display the same information. Hierarchy selections in the Resource table will impact the bar chart. There are columns/bars for:
- Remaining Units
- Planned Units
- Actual Units
In the bar chart, the x-axis shows Resource. The y-axis shows Units. Hover over a bar for details.
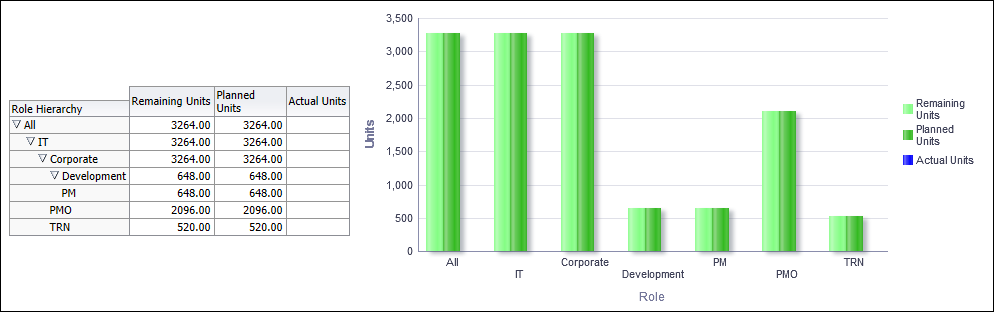
The Role pivot table and bar chart show units broken down by role. Both the table and the bar chart display the same information. Hierarchy selections in the Role table will impact the bar chart. There are columns/bars for:
- Remaining Units
- Planned Units
- Actual Units
In the bar chart, the x-axis shows Role. The y-axis shows Units. Hover over a bar for details.
Location
- On the Home page, click Dashboards.
- Under Primavera, select Resource Analysis.
- On the Resource Analysis dashboard, click the Staffing page.
- On the Staffing page, expand the Hierarchies section.
Subject Area
Resource Assignment