Purpose
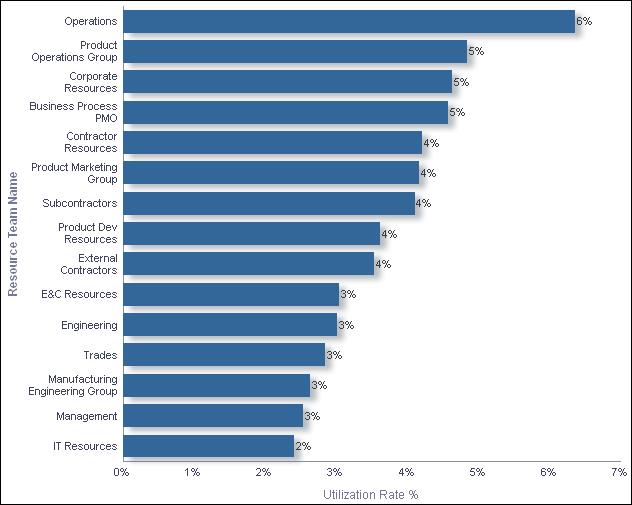
The bar chart shows the utilization rate percentage for each team. Resource utilization is a measure of a resource's allocated units against the resource limit. The values for each team are an aggregation of values for individual resources (rather than being calculated at team level). When a resource's utilization is more than 100%, the resource is overallocated.
The x-axis shows the Utilization Rate Percentage. The y-axis shows the Resource Team Name.
Location
- On the Home page, click Dashboards.
- Under Primavera, select Resource Analysis.
- On the Resource Analysis dashboard, click the Productivity page.
- On the Productivity page, expand the Resource Utilization by Team section.
Subject Area
Resource Utilization