Purpose
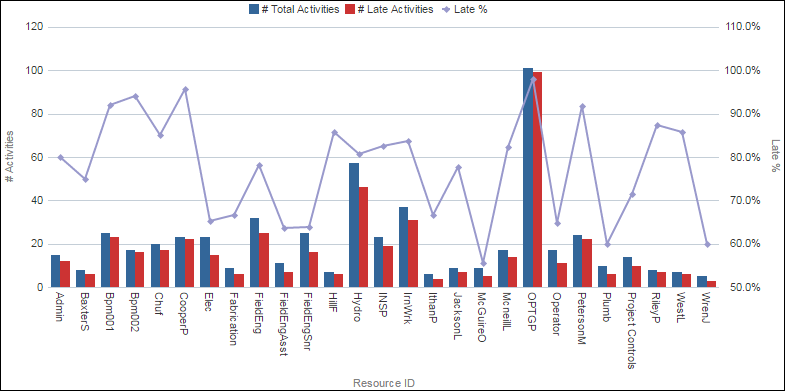
The line-bar chart displays poorly performing resources broken down by resource ID, number of activities, and late percentage.
The x-axis shows the resource ID. The y-axis for the bars, on the left, shows the number of total and late activities. The y-axis for the lines, on the right, shows late percentage. Hover over and click a bar or a point on a line to drill-down for detailed information.
Location
- On the Home page, click Dashboards.
- Under Primavera, select Resource Analysis.
- On the Resource Analysis dashboard, click the Productivity page.
- On the Productivity page, expand the Poorly Performing Resources section.
Subject Area
Activity