Purpose
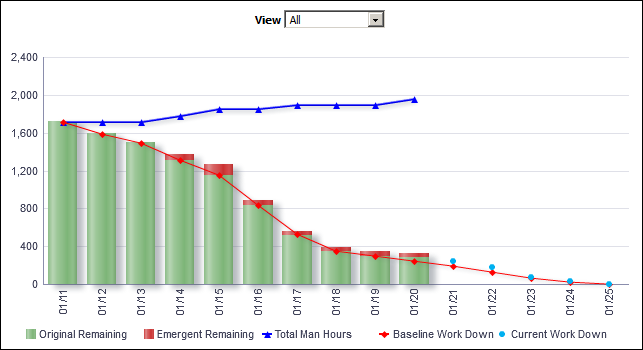
The line-bar chart shows burn down hours broken down by date. Use the View list to determine how the information is displayed. The available views are:
- All: This displays totals for the project.
- Resource Slider: This filters the chart by resource. The chart will update as the slider is moved.
The line-bar chart shows:
- Bars for Original Remaining and Emergent Remaining hours for each day
- Lines for the Total Man Hours, Baseline Work Down, and Current Work Down hours for each day
The x-axis shows the date. The y-axis shows hours.
Location
- On the Home page, click Dashboards.
- Under Primavera, select Industry Standards.
- On the Industry Standards dashboard, click the Shutdown/Turnaround/Outage page.
- On the Shutdown/Turnaround/Outage page, expand the Burn Down Hours section.
Subject Area
Burn Down