Purpose
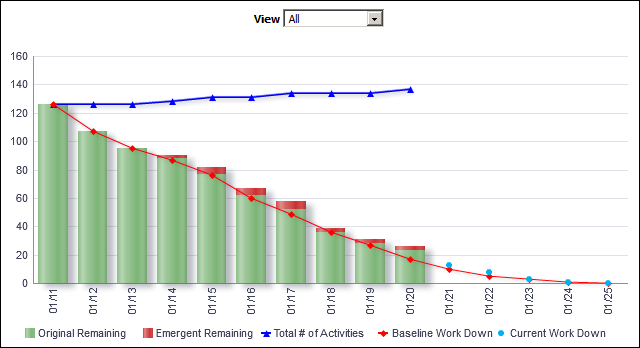
The line-bar chart shows burn down counts broken down by date. Use the View list to determine whether the information is displayed as All or Resource Slider. The line-bar chart shows:
- Bars for the Original Remaining and Emergent Remaining counts for each day
- Lines for Total Number of Activities, Baseline Work Down, and Current Work Down counts for each day
The x-axis shows days. The y-axis shows the number of activities.
Location
- On the Home page, click Dashboards.
- Under Primavera, select Industry Samples.
- On the Industry Samples dashboard, click the Shutdown/Turnaround/Outage page.
- On the Shutdown/Turnaround/Outage page, expand the Burn Down Counts section.
Subject Area
Burn Down