Purpose
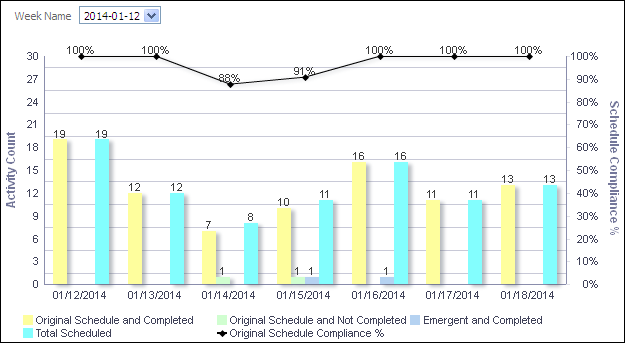
The line-bar chart shows:
- Bars for Original Schedule and Completed, Original Schedule and Not Completed, Emergent and Completed, and Total Scheduled
- A line for Original Schedule Compliance percentage (the percentage of activities which were completed on a day that were scheduled to be completed on that day)
The x-axis shows the month, day, and year. The y-axis for the bars, on the left, shows the Activity Count. The y-axis for the line, on the right, shows the Schedule Compliance Percentage. Filter the chart by week using the Week Name list. Click on a bar or point to show the data in a table.
Location
- On the Home page, click Dashboards.
- Under Primavera, select Industry Standards.
- On the Industry Standards dashboard, click the Shutdown/Turnaround/Outage page.
- On the Shutdown/Turnaround/Outage page, expand the Schedule Compliance section.
Subject Area
Burn Down