Purpose
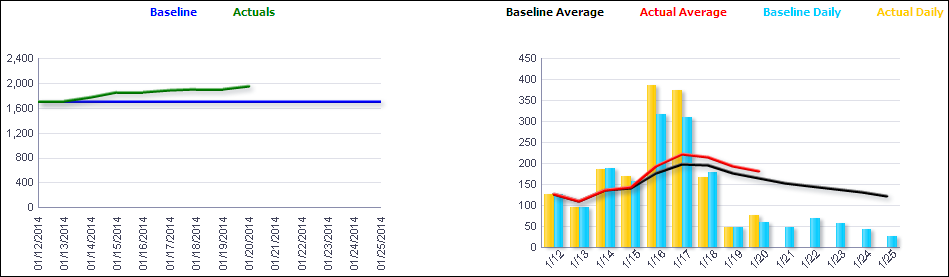
The analysis shows a Baseline, Actuals line chart and a Baseline Average, Actual Average, Baseline Daily, Actual Daily line-bar chart.
The Baseline, Actuals line chart shows lines for Baseline hours and Actuals hours for each day.
The x-axis shows dates. The y-axis shows hours.
The Baseline Average, Actual Average, Baseline Daily, Actual Daily line-bar chart shows:
- Bars for Baseline Daily hours and Actual Daily hours
- Lines for Baseline Average hours and Actual Average hours
The x-axis shows dates. The y-axis shows hours.
Location
- On the Home page, click Dashboards.
- Under Primavera, select Industry Standards.
- On the Industry Standards dashboard, click the Shutdown/Turnaround/Outage page.
- On the Shutdown/Turnaround/Outage page, expand the Average vs. Baseline (Hours) section.
Subject Area
Burn Down