Purpose
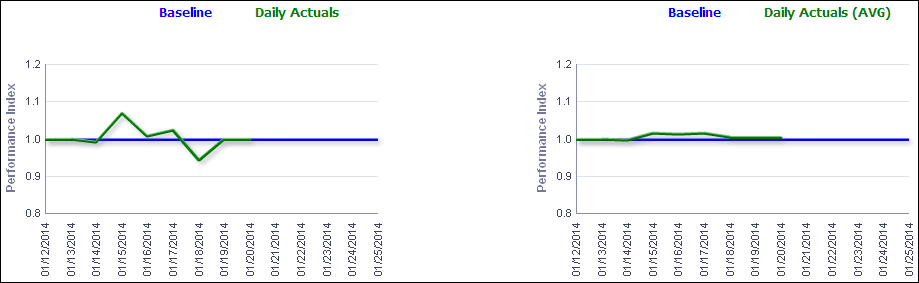
The analysis shows Baseline, Daily Actuals and Baseline, Daily Actuals (AVG) line charts.
The Baseline, Daily Actuals line chart shows lines for:
- Baseline (a constant, set to 1)
- Daily Actuals (calculated as Actual Labor Units divided by Planned Labor Units)
The x-axis shows dates. The y-axis shows Performance Index (calculated as Actual Labor Units divided by Planned Labor Units).
The Baseline, Daily Actuals (AVG) line chart shows lines for:
- Baseline (a constant, set to 1)
- Daily Actuals (calculated as a 365 day average of Actual Labor Units divided by Planned Labor Units)
The x-axis shows dates. The y-axis shows Performance Index (calculated as Actual Labor Units divided by Planned Labor Units).
Location
- On the Home page, click Dashboards.
- Under Primavera, select Industry Standards.
- On the Industry Standards dashboard, click the Shutdown/Turnaround/Outage page.
- On the Shutdown/Turnaround/Outage page, expand the Daily Performance Index (Hours) section.
Subject Area
Activity